Search This Blog

Saturday, May 30, 2015

Zabbix Templates for Windows LLD Discovery

This article describes Windows Server Zabbix Low Level Discovery (LLD) Templates that monitor core server functions.  While tested on Windows Server 2012 R2, it us likely  the Templates are compatible with other versions of Windows as well.

For those with Zabbix and Windows experience, the templates used are available from the Zabbix Share Templates page.  A previous version of Windows Templates is described in this blog post on Windows Server 2008 R2 Performance Monitoring.  The previous templates used Windows Performance Monitoring (_Total) and (*) instances to collect data.  While this provides overall systems performance indicators, it is not highly precise.  For instance, if the Disk Queue Write Length (_Total) exceeds the warning threshold, it applies to all disks on the server and does not identify the specific disk that is the problem.

Zabbix Low Level Discovery (LLD) provides more specific information about the hardware and software running on Windows Servers.  Three components are used:
  1. A Discovery Rule that defines what information will be obtained.
  2. A UserParameter statement in the Zabbix Agent zabbix.conf file defines what scripts will be used.
  3. A PowerShell script that queries the Windows Operating System and returns JavaScript Object Notation (JSON) formatted variables used in the Discovery Rule.
Instead of relying on (_Total) and (*) instances written into the counters, the Discovery Rule will enumerate individually-returned items, such as Logical Disks C:, D:, E:, etc.


Discovery Rules

Rule Definitions


Discovery Rules are written in the Zabbix Template.  The definition page requires:
  • Unique Name such as windowsldisk.discovery for Logical Disk Discovery
  • Type (Zabbix Agent for all rules in this article)
  • Key to define what UserParameter to run on the Zabbix Agent
  • Update Interval in seconds
You may also add Flexible Intervals and define how long items that are no longer discovered are retained.  The last feature is useful if you are, for example, monitoring SMB-mapped drives shared by a failover cluster.

Filters use regular expressions and macros to filter the returned results.  For instance, calling the {#FSTYPE} macro that uses the @File systems for discovery defined regular expression will return results for matching values (e.g. ext4, ntfs) and filter out those not desired (e.g. cdfs).

For Windows Server Discovery, the macro is simply defined from the data returned by a PowerShell script (see below) that filters on the server before returning values to Zabbix.  We do not need to define Zabbix-level filters and simply use the macro name defined in the PowerShell script.

Item Prototypes

Item prototypes are similar to regular items in format, except they typically reference a macro instead of a defined value.  For Windows Discovery, notice both the Name and Key contain the macro {#DISKNUMLET}.  This acts as a variable and references all of the items returned by the PowerShell script in JSON format.  As discussed in more detail below, the PowerShell script will filter all values to return the logical drives recognized by the operating system (C:, E:, F:, etc.) filtering out the CD drive.  Keep in mind logical drives include mapped SMB shares physically hosted on other servers.


Item details define how items will be stored, reported and -- importantly -- the macro and Zabbix operation performed.  The Type of operation is always Zabbix Agent because the process is sent to a remote agent for execution.  The perf_counter key instructs Zabbix to use a Windows Server-formatted Performance Monitoring item and pass the defined operation and macro name to the Agent.  The returned item is a Numeric (float) type and may be assigned appropriate units (Bytes, Bytes/sec, sec, millisec, etc.).  Value mapping may also be assigned.  These define how numeric values returned by the Agent are interpreted.  For Windows, the agent will return a numeric value for the service state.  The Value Mapping maps the numeric value to a human-readable value value (e.g. running, paused, stopped, etc.).

Trigger Prototypes

Collecting data is useful for trend analysis.  Triggers define thresholds at which Zabbix generates alerts.  A complete discussion of Triggers is beyond the scope of this article.  Windows Server-specific Triggers warrant description.

Microsoft's MSDN and Technet provide lists of suggested Performance Counter thresholds that are easily translated into Zabbix Triggers.  The illustration depicts a Warning Trigger for Logical Disk sec/Read (sec) on a specific drive; if the read time is greater than 0.015 seconds, Zabbix generates a Warning alert.  This trigger was then cloned and the threshold value changed to 0.025 seconds and Warning changed to High to create a higher-rated alert.  Decisions about forwarding may be made based upon the severity of the alert.

Graph Prototypes

Graphical displays of information are useful for trend analysis and diagnosing problems.  Zabbix Discovery Graph Prototypes are much like standard graphs but use macros in place of defined objects.  One graph prototype, as illustrated, calling macros will generate a graph for each item returned.  Thus, a Windows Server with three logical drives will have three of each graph and the macro will list each drive name in the title.


Zabbix Agent

The Zabbix Agent controls communications between the Windows Server operating system and Zabbix server.  Its configuration file -- zabix.conf -- defines the UserParameter functions that the Zabbix server passes to the agent in order to execute Windows PowerShell scripts.

Following the Logical Disk Discovery described above, the zabbix.conf file requires a UserParameter statement for each different script used.
UserParameter=windowsldisk.discovery,powershell -NoProfile -ExecutionPolicy Bypass -File c:\scripts\get_ldisks.ps1
This UserParameter line responds to calls from the the Zabbix server windowsldisk.discovery definition and invokes PowerShell to run with the privileges necessary to execute the script c:\scripts\get_ldisks.ps1.  The agent then returns the values to the Zabix server.

PowerShell Scripts

PowerShell is the Microsoft Windows scripting language used to query Performance Monitoring. The following script queries the Logical Disks Performance Counters and returns the macro-defined {#DISKNUMLET} and drive number-letter name:

  1. $drives = Get-WmiObject win32_PerfFormattedData_PerfDisk_LogicalDisk | ?{$_.name -ne "_Total"} | Select Name
  2. $idx = 1
  3. write-host "{"
  4. write-host " `"data`":[`n"
  5. foreach ($perfDrives in $drives)
  6. {
  7. if ($idx -lt $drives.Count)
  8. {
  9. $line= "{ `"{#DISKNUMLET}`" : `"" + $perfDrives.Name + "`" },"
  10. write-host $line
  11. }
  12. elseif ($idx -ge $drives.Count)
  13. {
  14. $line= "{ `"{#DISKNUMLET}`" : `"" + $perfDrives.Name + "`" }"
  15. write-host $line
  16. }
  17. $idx++;
  18. }
  19. write-host
  20. write-host " ]"
  21. write-host "}"
Line 1 invokes the LogicalDisk query command and filters out the _Total item, returning only the counters' names (not the voluminous additional data associated with each).  Line 2 sets an index at 1 and Line 17 increments it.  Lines 3 and 4 write the required headers for JSON format.  Lines 5 through 16 query each drive item returned in Line 1 and writes a formatted pair -- {#DISKNUMLET} and Drive Name -- in JSON format.  Lines 19 through 21 then complete the JSON-formatted response.
{

"data":[

{ "{#DISKNUMLET}" : "C:"},
{ "{#DISKNUMLET}" : "E:"},
{ "{#DISKNUMLET}" : "F:"},
{ "{#DISKNUMLET}" : "G:"}

 ]
}
Don't try to look up a list of Get-WmiObject commands because what Microsoft documents is incomplete.  There are simply too many and they are installed as needed with Roles and Applications.  Fortunately, PowerShell also provides a command syntax that will export all available Get-WmiObject commands to a .csv-format file:
Get-WmiObject -List | Where-Object { $_.name -match 'perfformatted' } | Export-CSV c:\scripts\perfformatted.txt
You may the search this lengthy document for the syntax needed to create other PowerShell scripts.

Summary

You may manually install the Zabbix Agent on Windows host, script the installation or use Group Policy.
  1. Create a Zabbix Discovery rule with a named macro, filters (if necessary) items, triggers and graphs.
  2. Add UserParameter statements to the client agent zabbix.conf file referencing the Zabbix Discovery rule and calling PowerShell scripts.
  3. Add PowerShell scripts to the client.

Windows Server Templates

There are two Templates on Zabbix Share for Windows Server Discovery:
The first template is adequate for day-to-day monitoring and trend analysis.  The second template is very thorough, Zabbix Serverv-intensive and intended for diagnosing difficult problems.

Each .zip file downlaod contains the template, UserParameter statements to be added to the zabbix.conf file and PowerShell scripts to be placed in the c:\scripts directory.  There is a brief README file explaining what needs to be done.

Saturday, April 11, 2015

Linux Layer 3 Cisco Router and Open vSwitch with NetFlow Virtualization

Configuring Cisco and Open Switch Routers and Layer 3 devices to send NetFlow data to a Linux NTOP NetFlow collector to interpret higher layer network flows.

Introduction

Layer 2 and Layer 3 Linux Switching (using kernel-supported utilities) is fast and efficient.  Open vSwitch -- when combined with an OpenFlow controller -- is a full-blown Software Defined Networking (SDN) implementation that offers the advantages of offloading topology and switching decisions to a centralized controller, allowing the Open vSwitch devices to primarily switch frames instead of expending processor and memory resources on topology maintenance and decision-making.
Open vSwitch devices are also Layer 3 and above aware, able to modify traffic based upon Layer 3 (IP address) and Layer 4 (TCP port) information.  However, an administrator needs quality information to make prioritization and routing decisions and OpenFlow controllers provide mostly Layer 2 information.  Systems monitoring devices -- MRTG, Cacti, Munin, Nagios/Icinga and Zabbix -- operate primarily at the device level (e.g. interface utilization, interface errors, interface congestion) and are difficult, if not impossible, to configure for detailed analysis.  Firewalls and access lists operate at the requisite levels (Layers 2, 3 and 4) for detailed traffic analysis, but require a great deal of manual configuration and interpretation to characterize traffic.
The term used for this kind of detailed traffic characterization is Flows.  Each flow has unique end devices, IP addressing and TCP ports.  At the flow level, each step in the path between end devices (i.e. intermediary switches and routers) also records traffic.  As stated above, OpenFlow controllers report this quite well at Layer 2.  Other protocols, such as NetFlow and OpenFlow, provide the higher-level information required to more precisely characterize and manage traffic.

Configuring Open vSwitch Layer 3 Switching

There are several ways to implement Layer 3 functionality, such as fake bridges and VLANs.  From a monitoring perspective, these can be somewhat problematical because they do not appear in SNMP MIBs.

This article will use multiple bridges on each Layer 3 Open vSwitch to define multiple networks.  Bridge and port membership is defined with the ovs-vsctl set of commands.  IP address assignments to the bridges is managed at boot time in the /etc/network/interfaces file.  Routing is managed using Quagga.

In the topology at the top of the article, there is routing configured on the Cisco R1 gateway and Open vSwitch devices Switch-01 and Switch-05.  All are members of OSPF Area 10.128.0.0 (range 10.128.0.0/13 with configured networks 10.128.0.0/24 and 10.128.1.0/24) and the Cisco router is also a member of the host laptop's Backbone Area 0.0.0.0 (range 172.16.0.0/12).

Switch-01 Configuration

The /etc/network/interfaces File

auto eth0
iface eth0 inet manual

auto eth1
iface eth1 inet manual

auto eth2
iface eth2 inet manual

...
auto eth7
iface eth7 inet manual

auto br0
iface br0 inet static
    address 10.128.0.254
    netmask 255.255.255.0
    network 10.128.0.0
    broadcast 10.128.0.255
    gateway 10.128.0.1
    # dns-* options are implemented by the resolvconf package, if installed
    dns-nameservers 192.168.1.1
    dns-search mydomain.com

auto br1
iface br1 inet static
    address 10.128.1.254
    netmask 255.255.255.0
    network 10.128.1.0
    broadcast 10.128.1.255
    # dns-* options are implemented by the resolvconf package, if installed
    dns-nameservers 192.168.1.1
    dns-search mydomain.com

Open vSwitch Configuration

18ce5ab3-d025-49c2-8cd8-0a41d3927c79
    Bridge "br1"
        Controller "tcp:10.128.0.102:6633"
            is_connected: true
        Port "eth4"
            Interface "eth4"
        Port "br1"
            Interface "br1"
                type: internal
    Bridge "br0"
        Controller "tcp:10.128.0.102:6633"
            is_connected: true
        Port "eth1"
            Interface "eth1"
        Port "eth6"
            Interface "eth6"
        Port "eth5"
            Interface "eth5"
        Port "eth3"
            Interface "eth3"
        Port "br0"
            Interface "br0"
                type: internal
        Port "eth7"
            Interface "eth7"
        Port "eth2"
            Interface "eth2"
        Port "eth0"
            Interface "eth0"
    ovs_version: "2.1.3"

The Quagga OSPF Configuration

router ospf
 ospf router-id 10.128.0.254
 network 10.128.0.0/24 area 10.128.0.0
 network 10.128.1.0/24 area 10.128.0.0
 area 10.128.0.0 range 10.128.0.0/13

Switch-05 Configuration

The /etc/network/interfaces file

auto eth0
iface eth0 inet manual

auto eth1
iface eth1 inet manual

auto eth2
iface eth2 inet manual
...
auto eth7
iface eth7 inet manual

auto br0
iface br0 inet static
    address 10.128.1.250
    netmask 255.255.255.0
    network 10.128.1.0
    broadcast 10.128.1.255
    # dns-* options are implemented by the resolvconf package, if installed
    dns-nameservers 192.168.1.1
    dns-search mydomain.com


Open vSwitch Configuration

18ce5ab3-d025-49c2-8cd8-0a41d3927c79
    Bridge "br0"
        Controller "tcp:10.128.0.102:6633"
            is_connected: true
        Port "eth1"
            Interface "eth1"
        Port "eth6"
            Interface "eth6"
        Port "eth0"
            Interface "eth0"
        Port "eth5"
            Interface "eth5"
        Port "eth3"
            Interface "eth3"
        Port "br0"
            Interface "br0"
                type: internal
        Port "eth4"
            Interface "eth4"
        Port "eth7"
            Interface "eth7"
        Port "eth2"
            Interface "eth2"
    ovs_version: "2.1.3"

The Quagga OSPF Configuration

router ospf
 ospf router-id 10.128.1.250
 network 10.128.1.0/24 area 10.128.0.0
 area 10.128.0.0 range 10.128.0.0/13

Installing NTOP on Ubuntu 14.04 Trusty Tahr

Keep in mind NTOP is not NTOP-NG.  NTOP-NG is the current version of the utility, but it decouples NetFlow from the application and requires the paid nProbe package.  For this article, we will use the older -- but still useful -- original NTOP.

The Easy (and Broken) Way

It's very easy -- apt-get install ntop.  You will need to configure the listening interface(s) and supply an administrator password.

The problem with this installation is the package does not install the visualization packages required for elements like pie graphs and host details, despite using the last version (5.0.1 dated 2012-08-13).  The package does not provide the full range of ntop features.

Compiling from Source

Install dependencies
sudo apt-get install libpcap-dev libgdbm-dev libevent-dev librrd-dev python-dev libgeoip-dev automake libtool subversion
sudo apt-get build-dep ntop 
Extract and compile
tar zxvf ntop-5.0.1.tar.gz
cd ntop-5.0.1
./autogen
make
sudo make install
Copy libraries to the correct location, change ownership of the executable and restart the service
sudo cp /usr/local/lib/libntop* /usr/lib/
sudo chown -R ntop.ntop /usr/local/share/ntop
sudo service ntop restart

Configuring NTOP

The installation process specifies one or more listening interfaces.  These are available without additional configuration.  The overview report provides information about this (ese) interface(s), such as packet distribution and size.


 There is also a tab for protocol distribution.
 

 And another for Application Protocols.

In a switched environment, an interface in promiscuous mode will still only capture unicast traffic switched to its own port, broadcast and multicast traffic.  The capture does not reflect overall network activity.

One option to capture traffic is port mirroring, in which all traffic on a specified interface is forwarded to another (in this case, the NTOP monitor).  The drawbacks to port mirroring are manual configuration, the added bandwidth and processing required.  Even using virtio network devices on virtualized machines, the processing and memory bandwidth will contribute to added load on the host.

NetFlow

Netflow is a set of services developed by Cisco.   Briefly, a NetFlow capable device summarizes traffic, formats it and forwards it to a collector over UDP.  Version 9 is current at the time of writing and its format is detailed here.  Essentially, it provides a summary of TCP/IP protocol, address and application information the collector may store, format and present.

Configuring NTOP NetFlow Collector

From the main menu, select Plugins and click on the NetFlow option.
There are three important fields:  NetFlow Device, Local Collector UDP Port and Virtual NetFlow Interface Network Address.

NetFlow Device

This is a unique name to identify a network-specific collector.

Local Collector UDP Port

This specifies the UDP port on which the collector listens.  2055 is the current default.

Virtual NetFlow Interface Network Address

This is NOT an IP address, but a network address that corresponds to the network from which device(s) send information.  In the configuration used in this article it is 10.128.0.0/24, which will save as 10.128.0.0/255.255.255.0.  This virtual interface may be the destination for more than one collector on each defined network.  In this article, we will configure a Cisco router and Ubuntu Open vSwitch to forward NetFlow information to the NTOP server.

There are other options available, but they will not be discussed in this article. 

Configuring Cisco NetFlow


The following commands begin with configuring NetFlow to operate on interface FastEthernet0/1, collecting inbound and outbound data.   Then we configure the router export dource interface, timeouts, NetFlow version and (finally) the destination IP address and UDP port of the NTOP server.
R1#configure terminal
R1(config)#interface f0/1
R1(config-if)#ip route-cache flow
R1(config-if)#ip flow ingress
R1(config-if)#ip flow egress
R1(config-if)#exit
R1(config)#ip flow-export source f0/1
R1(config)#ip flow-cache timeout active 60
R1(config)#ip flow-cache timeout inactive 120
R1(config)#ip flow-export version 5
R1(config)#ip flow-export destination 10.128.1.104 2055

Configuring Open vSwitch Netflow

First some background on Open vSwitch and OpenFlow (e.g. Floodlight) controllers.  Open vSwitch alone operates quickly at Layer 2 -- a bridge or switch.  The OpenFlow controller centralizes MAC address logic and topologies and is a decision relieves the connected Open vSwitch of logic and topology decisions.  Yet Open vSwitch is also aware of higher layers of the network stack -- Layer 3 IP, Layer 4 TCP, etc. The deficiency of existing OpenFlow controllers is a lack of detailed Layer 3 and above information upon which to make configuration decisions such as prioritization.  Enter NetFlow.

The following command (one statement) configures Open vSwitch NetFlow for bridge br0 and forward it to the NTOP NetFlow collector with an active timeout of 120 seconds:
sudo ovs−vsctl set Bridge br0 netflow=@nf0 -- --id=@nf0 create NetFlow targets=\"10.128.1.104:2055\" active_timeout=120
More than one bridge on each device may then be added, such as br1, with the command:
ovs-vsctl set Bridge br1 netflow=[_uuid]

Viewing NetFlow Information on NTOP

Switch to the Netflow interface configured above if you have not already done so.  The interface is identical, but now that NetFlow is collecting all port and host information for the network 10.128.0.0/24, there will be much more information.


The Zabbix Proxy in the network collects information from all hosts and devices.  Click on its address (DNS is not configured on this network, but NTOP will use it when available).
Details of traffic between the Zabbix Proxy and the hosts it monitors are presented as an overview and in detail.  Of particular interest, the process of querying monitored devices requires very little bandwidth compared to that required to forward data from the Zabbix Proxy (10.128.0.103) to the Zabbix Server (10.128.0.101).


Top talkers are also identified and graphed.


Tuesday, April 7, 2015

Linux Layer 2 Open vSwitch with Floodlight Virtualization

Illustrates how to configure Open vSwicth and its web interface Floodlight to connect to VirtualBox and GNS3 virtual machines.  Also illustrates integrating Zabbix to monitor the topology.


Introduction

Open vSwitch is a multilayer switch capable of distribution across multiple physical hosts.  It supports standard management tools and protocols (OpenFlow, NetFlow, SFlow, etc.).   Floodlight is a Java web-based monitoring interface that reports information about bridges, attached hosts and flows.

As of version 3.12, the Linux kernel supports Open vSwitch; older kernels require a compiled kernel module.  At the time of writing, Debian Wheezy (kernel version 3.2.x) does not include native support, so this article focuses on Ubuntu Trusty Tahr (14.04) with a 3.13.x kernel.

Open vSwitch on an Ubuntu Host

Installation

Ubuntu 14.04 includes a kernel with Open vSwitch support, so installation from the repository is simple:
sudo apt-get install openvswitch-switch

Configuration

For a simple Layer 2 implementation, configuration requires only five steps, the last of which is optional:

  1. Create the bridge
  2. Add ports to the bridge
  3. Set the Floodlight controller
  4. Assign an IP address
  5. Configure SNMP

The first three steps use the ovs-vsctl command line utility while the last two are standard Debian/Ubuntu configurations.

Create the Bridge

Create the bridge with the command:
sudo ovs-vsctl add-br <bridge name> or, specifically,
sudo ovs-vsctl add-br br0

Add Interfaces to the Bridge

There are eight network interfaces on each VirtualBox VM (see this article for information on adding more than four interfaces to VirtualBox appliances).  Add them to the bridge with the commands:
sudo ovs-vsctl add-port <bridge name> <port name> or, specifically,
sudo ovs-vsctl add-port br0 eth0
sudo ovs-vsctl add-port br0 eth1
...
sudo ovs-vsctl add-port br0 eth7

Set the Floodlight Controller

The Floodlight controller is a centralized appliance that controls decision making in the network.  More on that below.  For now, configure each switch to use the Floodlight controller Host-02 at the IP address 10.120.0.102 listening on TCP port 6633:
sudo ovs-vsctl set-controller <bridge name> <controller> or, specifically,
sudo ovs-vsctl set-controller br0 tcp:10.128.0.102:6633

Assign an IP Address

This scenario uses cloned Ubuntu VirtualBox appliances.  Their initial IP addresses must be changed and default gateway (10.128.0.1) reset.  Use the iproute2 set of commands to reconfigure networking:
ip address del <existing IP address/CIDR mask> dev <interface>
ip address add <IP address/CIDR mask> dev <interface>
ip route add 0.0.0.0/0 via <gateway address>
For the cloned Ubuntu VirtualBox switches used in this scenario with the IP address 10.120.0.201/24 assigned to interface eth0:


ip address del 10.128.0.201/24 dev eth0
ip address add 10.128.0.x/24 dev br0
ip route add 0.0.0.0/0 via 10.128.0.1
The Ubuntu switches are numbered starting at 10.128.0.254 and descend as new ones are added. Restart networking and then change the /etc/network/interfaces file to reflect the operational configuration.

Configure SNMP

This step is optional.  However, if you wish to monitor the devices using SNMP application, see this article for more information.  Adding additional SNMP MIBs is not necessary; only SNMP Daemon support is required.


Floodlight Controller on the Linux Host

Floodlight is an OpenFlow-compliant controller.  Open vSwitch, also being OpenFlow compliant, may use Floodlight.  A simple explanation of Software-Defined Networking (SDN) is a system in which the frame and packet forwarding (the data plane) is separated from the forwarding decision logic (the control plane).

Traditional switches MAC address tables and exchange topology information to build forwarding logic on each switch.  They may also run Spanning Tree Protocol (and other protocols) to optimize forwarding decisions.  Two problems (among others) with this approach is that it 1) consumes processing and memory resources on each device and 2) requires time, processor and memory resources for network topology changes to converge.

SDN networking, removes the decision-making logic from individual switches and replaces it with a centralized controller -- in this case Floodlight -- that stores all MAC and topology information on a single server.  There are advantages to this system, including rapid change convergence, faster switch performance and a complete topological map available to administrators for manual configurations (such as prioritization and filtering).

There is a significant drawback to SDN OpenFlow controllers: they are a single point of failure.

Installation and Configuration

Installation requires no more than using apt to get all necessary packages from the repositories:
sudo apt-get install floodlight
Floodlight is a Java application, so a lot of additional packages are required.  That's it.  Once installed, it will listen on TCP port 8080 of all network interfaces.

Floodlight Web Interface

The Floodlight web interface only provides information about the switches and hosts.

Dashboard


The Dashboard provides an overview of network devices including switches, MAC and IP addresses, number of flows, total data transfers and controller processes.

Topology


Topology provides an application-generated overview of switches, hosts, MAC and IP addresses and the connections between devices.  However, it is not easily configurable, crowded, poorly-organized and difficult to interpret even in small networks.

Switches

The Switches overview lists each configured switch by MAC and IP addresses and includes total data transfers and flows on each.
Clicking on the linked MAC address (DPID) of each switch provides port- and flow-level detail of each switch.

Hosts

Hosts provides an overview of each unique MAC address on the network -- be it a switch, router or server.  It also indicates the MAC address to which each device is connected.

Floodlight REST API

The Floodlight REST API provides a URL-based interface to more detailed information about the controller and configured switches.  For instance, the URL http://<controller>:8080/wm/topology/links/json provides a summary of each switch-to-switch link.


The link above lists all of the URLs included in the current Floodlight release.

Floodlight Avior

Avior is a Java application developed and maintained by Marist College and IBM among others.  This graphical interface provides overviews similar to the Floodlight web interface and -- more importantly -- configuration options for flows, filtering and many other Layer 2, 3 and 4 traffic control.  This article provides only a brief overview of the application.  The figures below are the Switches and Devices options -- analogous to Switches and Hosts in the Floodlight web application.


The illustrations below provide an overview of flow configuration.  The various Layer 2, 3 and 4 flow control decision logic may be defined on the controller.


Once the flow rules are defined, simply push them to the applicable switch and the rule is in effect.

Zabbix Integration

This blog contains two previous articles pertinent to discovering and monitoring SNMP networking devices with Zabbix:
SNMP -- Simple Network Management Protocol for Linux Management Stations
Zabbix SNMP Low Level Router Discovery

As the illustration at the top of this posts indicates, there is a Zabbix Server and Zabbix Proxy in the topology.  They are configured to use SNMP Network Device templates (on the Zabbix Share) to automate device discovery:
  1. Template_SNMP_Network_Device_Interfaces
  2. Template_SNMP_Router_Cisco
  3. Template_SNMP_Router_OSPF


The illustrations above depict the Discovered Hosts and a single interface graph on one device.
Sunday, March 22, 2015

Linux Host Virtualization Networking


Optimizing and testing Linux Layer 2 and Layer 3 host networking tun/tap, bridge and routing options for host-to-VM and VM-to-VM connectivity for QEMU/KVM, VirtualBox and GNS3.  Includes performance tests for QEMU/KVM networking options that indicate 12.0 Gb/s to 18.8 Gb/sec sustained throughput for Linux host switching and routing.

Introduction

Linux distributions -- through the kernel and additional packages -- includes support for a variety of Layer 2 and Layer 3 networking features.  At Layer 2, it supports bridges, switching and VLANs.  At Layer 3, it supports IP routing and routing protocols such as RIP, OSPF, EIGRP, etc.  This article illustrates configuring various Linux host networking features to provide connectivity between GNS3 and QEMU/KVM networks.

The current Linux networking toolkit is iproute2 -- replacing older net-tools (ifconfig, ARP, etc.) and other (bridge-utils, tunctl, vlan, etc.) with one package.  However, some of the features in the older tools are still useful and will be installed.

The host laptop has quad-core Core i5 3230M, 2.60 GHz processors and 6 GB memory.  The QEMU/KVM VMs used for testing were assigned 4 cores each and 2 GB memory.

Linux Layer 2 Features

Layer 2 of the OSI model -- the Data Link Layer -- provides a variety of lower-level services.  Frames use Media Access Control (MAC) addresses to identify the source and destination addresses on a single Local Area Network.  MAC addresses are hard-coded into network interfaces (although they may be changed is the operating system supports that) and unique.  Destination addresses are discovered with broadcasts (and ARP) that flood the LAN; a single LAN is a broadcast domain.  Switching and bridging refers to transmitting frames from source to destination based upon MAC addresses.  Traditionally, a bridge has two interfaces and a switch more than two.  Thus, Layer two only operates on LANs and requires higher-level networking to transmit between LANs.

Linux Layer 2 Switching and Bridging

The current iproute2 toolkit may be used to create bridged interfaces.  However, there is additional functionality on the older bridge-utils toolkit that also integrates more easily with the Debian-style /etc/network/interfaces configuration file.

Linux tun and tap Devices

These are pseudo devices created in software and not physical ones.  At Layer 3, tun devices work at the packet level and typically used for tunnelling protocols.  For switching, tap devices operates at the Data Link layer and simulate a single interface.

You may use the older bridge-utils tunctl command or newer iproute2 command to create tap devices:
tunctl -t tap0
or
ip tuntap add tap0 mode tap
You may also create these devices at boot time using the Debian-style /etc/network/interfaces file:
auto tap0
iface tap0 inet manual
pre-up tunctl -t tap0
or
pre-up ip tuntap add tap0 mode tap
 The devices may also be configured with IP addresses by specifying "iface tap0 inet static" and the address, netmask and (optionally) gateway.

Linux Bridges and Switches

Bridges and switches -- multiport bridges -- are also available.  For the balance of this section, I will refer to both bridges and switches as bridges.  They are quite flexible in that you do not have to define specific ports as members or even a total number of logical ports in a bridge. The newer iproute2 toolkit supports creating bridges, however the older bridge-utils package is (in the author's opinion) easier to use and provides more granular control of bridge configuration.  From the brctl help command:


  • addbr         <bridge>        add bridge
  • delbr         <bridge>        delete bridge
  • addif         <bridge> <device>    add interface to bridge
  • delif         <bridge> <device>    delete interface from bridge
  • hairpin       <bridge> <port> {on|off}    turn hairpin on/off
  • setageing     <bridge> <time>        set ageing time
  • setbridgeprio    <bridge> <prio>        set bridge priority
  • setfd         <bridge> <time>        set bridge forward delay
  • sethello      <bridge> <time>        set hello time
  • setmaxage     <bridge> <time>        set max message age
  • setpathcost    <bridge> <port> <cost>    set path cost
  • setportprio    <bridge> <port> <prio>    set port priority
  • show          [ <bridge> ]        show a list of bridges
  • showmacs      <bridge>        show a list of mac addrs
  • showstp       <bridge>        show bridge stp info
  • stp           <bridge> {on|off}    turn stp on/off
For this article, we will focus on creating bridges at boot time in the /etc/network/interfaces file:
auto br0
iface br0 inet static
address 172.31.254.1
netmask 255.255.255.0
bridge_stp on
bridge_fd 0
bridge_ports tap0
These specify a bridge with an address and netmask (but no gateway) with a single defined interface -- tap0.  Spanning Tree Protocol -- to identify and prevent bridge loops -- is enabled and there is no forwarding delay when the bridge becomes active.  More interfaces may be added to the bridge using virtual networking -- such as GNS3 and QEMU/KVM, but more on that later.

It is not necessary to use tap interfaces with numbered, empty bridges.  Some virtualization technologies, such as VirtualBox, refer to this as Host-Only Networking because the VMs can communicate with each other and the host, but not outside networks.  Simply omit the bridge_ports definition:
auto br0
iface br0 inet static
address 172.31.254.1
netmask 255.255.255.0
bridge_stp on
bridge_fd 0
In the above case, tap0 is the operating system's logical interface connection to the bridge. It does not have to be numbered as the OS will recognize the bridge itself as having the assigned IP address. You are not limited to adding host tap interfaces to the bridge and physical Ethernet devices may be added as well. Wireless interfaces may also be added, but require additional configuration that will not be addressed in this article.

Layer 2 Host Networking Performance

bandwidth is an important consideration and there is a lot of misinformation about Linux tun and tap performance scattered around the Internet -- further proving the satirical adage "I read it on the Internet, it must be true!"  The author's limited searches suggested tap interfaces "theoretically" perform at up to 160 Mb/s, but in reality perform at under 10 Mb/s (less than a 20-year-old Ethernet NIC).

The following output is from a 60-second iperf test between the host (Ubuntu 14.04 Desktop) and a QEMU/KVM virtual machine (Debian Wheezy) over a tap/bridge connection:
~$ iperf -c 172.31.253.2 -t 60 -i 10
------------------------------------------------------------
Client connecting to 172.31.253.2, TCP port 5001
TCP window size:  136 KByte (default)
------------------------------------------------------------
[  3] local 172.31.253.1 port 50211 connected with 172.31.253.2 port 5001
[ ID] Interval       Transfer     Bandwidth
[  3]  0.0-10.0 sec  21.7 GBytes  18.7 Gbits/sec
[  3] 10.0-20.0 sec  22.5 GBytes  19.3 Gbits/sec
[  3] 20.0-30.0 sec  21.8 GBytes  18.7 Gbits/sec
[  3] 30.0-40.0 sec  21.3 GBytes  18.3 Gbits/sec
[  3] 40.0-50.0 sec  21.9 GBytes  18.8 Gbits/sec
[  3]  0.0-60.0 sec   131 GBytes  18.8 Gbits/sec
The following output is from a 60-second iperf test between the host (Ubuntu 14.04 Desktop) and a QEMU/KVM virtual machine (Debian Wheezy) over a bridge (no tap interface) connection:
~$ iperf -c 172.31.254.3 -t 60 -i 10
------------------------------------------------------------
Client connecting to 172.31.254.3, TCP port 5001
TCP window size: 85.0 KByte (default)
------------------------------------------------------------
[  3] local 172.31.254.1 port 34266 connected with 172.31.254.3 port 5001
[ ID] Interval       Transfer     Bandwidth
[  3]  0.0-10.0 sec  21.6 GBytes  18.5 Gbits/sec
[  3] 10.0-20.0 sec  20.9 GBytes  18.0 Gbits/sec
[  3] 20.0-30.0 sec  21.0 GBytes  18.1 Gbits/sec
[  3] 30.0-40.0 sec  21.6 GBytes  18.6 Gbits/sec
[  3] 40.0-50.0 sec  21.1 GBytes  18.2 Gbits/sec
[  3] 50.0-60.0 sec  22.0 GBytes  18.9 Gbits/sec
[  3]  0.0-60.0 sec   128 GBytes  18.4 Gbits/sec

The following output is from a 60-second iperf test between the two QEMU/KVM virtual machines (Debian Wheezy) over a tap/bridge connection:
~# iperf -c 172.31.253.2 -t 60 -i 10
------------------------------------------------------------
Client connecting to 172.31.253.2, TCP port 5001
TCP window size: 23.5 KByte (default)
------------------------------------------------------------
[  3] local 172.31.253.3 port 33823 connected with 172.31.253.2 port 5001
[ ID] Interval       Transfer     Bandwidth
[  3]  0.0-10.0 sec  14.1 GBytes  12.1 Gbits/sec
[  3] 10.0-20.0 sec  14.3 GBytes  12.3 Gbits/sec
[  3] 20.0-30.0 sec  14.5 GBytes  12.4 Gbits/sec
[  3] 30.0-40.0 sec  14.3 GBytes  12.3 Gbits/sec
[  3] 40.0-50.0 sec  14.2 GBytes  12.2 Gbits/sec
[  3]  0.0-60.0 sec  84.1 GBytes  12.0 Gbits/sec

The following output is from a 60-second iperf test between the two QEMU/KVM virtual machines (Debian Wheezy) over a bridge (no tap interface) connection:
~# iperf -c 172.31.254.2 -t 60 -i 10
------------------------------------------------------------
Client connecting to 172.31.254.2, TCP port 5001
TCP window size: 23.5 KByte (default)
------------------------------------------------------------
[  3] local 172.31.254.3 port 59334 connected with 172.31.254.2 port 5001
[ ID] Interval       Transfer     Bandwidth
[  3]  0.0-10.0 sec  16.0 GBytes  13.7 Gbits/sec
[  3] 10.0-20.0 sec  16.1 GBytes  13.8 Gbits/sec
[  3] 20.0-30.0 sec  16.1 GBytes  13.8 Gbits/sec
[  3] 30.0-40.0 sec  15.8 GBytes  13.5 Gbits/sec
[  3] 40.0-50.0 sec  15.4 GBytes  13.2 Gbits/sec
[  3]  0.0-60.0 sec  95.0 GBytes  13.6 Gbits/sec

Properly configured, Layer 2 networking performance between Linux hosts and VMs is excellent.  Bandwidth between VMs is less than between host and VM; a 13.3% performance improvement was realized by using bridges without a host tap interface.

Adding Virtual Machine Interfaces to Linux Layer 2 Devices

QEMU/KVM


Using the Qemu/KVM Virtual Machine Manager is the easiest way to connect to host machine networks.  Virtual Machine Manager automatically recognizes configured host tap/bridge devices and offers to bridge its own virtual NICs to a tap interface.
The choice of NIC models is also important and the paravirtualized Virtio device offers better performance than fully virtualized devices such as Intel e1000 NICs.
 The optimal QEMU/KVM configuration -- an empty bridge (i.e. a host bridge qithout an attached tap interface) is illustrated above.

VirtualBox


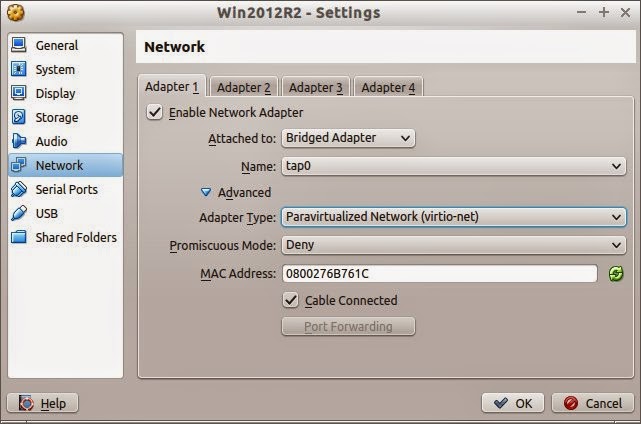
The selections for VirtualBox guests are much the same as for QEMU/KVM guests.  Under Network, select "Bridged Adapter" and "tap0" (or another tap interface if so desired).  Open the Advanced settings and select the Paravirtualized Network (virtio-net).

GNS3

GNS3 connections to the host are more detailed and have been described in another post.

Linux Layer 3 Routing

The Linux kernel supports static Layer 3 IP routing.  However, virtualized environments (particularly using GNS3) are better served by routing protocols.  This article describes how to implement a relatively portable OSPF configuration that, with minimal configuration, connects virtual machines and networks to the Internet.

Quagga Routing Protocols

Quagga is a fork of the inactive Zebra project.  For the subject host, it will implement OSPF to route between the host, Internet and virtual networks.  A previous post discusses the topic in detail.

For this implementation, the backbone area (range 172.16.0.0/12) will be the host Linux laptop itself.  The wireless network's DHCP network and tap/bridge interfaces will be areas attached to the backbone.

Layer 3 VM Networking Performance

Layer 3 routing between networks typically involves additional overhead and resulting lower speeds than Layer 2 switching.  Under Linux host networking using two different numbered bridges (without tap interfaces), there appears to be a small degree of such reduced performance, albeit quite small.
~# iperf -c 172.31.254.2 -t 60 -i 10
------------------------------------------------------------
Client connecting to 172.31.254.2, TCP port 5001
TCP window size: 23.5 KByte (default)
------------------------------------------------------------
[  3] local 172.31.253.3 port 57056 connected with 172.31.254.2 port 5001
[ ID] Interval       Transfer     Bandwidth
[  3]  0.0-10.0 sec  15.3 GBytes  13.2 Gbits/sec
[  3] 10.0-20.0 sec  15.2 GBytes  13.1 Gbits/sec
[  3] 20.0-30.0 sec  15.4 GBytes  13.2 Gbits/sec
[  3] 30.0-40.0 sec  15.3 GBytes  13.1 Gbits/sec
[  3] 40.0-50.0 sec  14.6 GBytes  12.6 Gbits/sec
[  3] 50.0-60.0 sec  14.4 GBytes  12.4 Gbits/sec
[  3]  0.0-60.0 sec  90.2 GBytes  12.9 Gbits/sec
 

Host Wireless Adapter

The author uses many wireless networks and they are (fortunately) all configured to assign DHCP addresses in the 192.168.x.x range, although on a variety of different 24-bit CIDR masks.  They also assign a static default gateway.  While it is possible to add a wireless adapter to a bridge, it is easier to configure OSPF to treat the wireless adapter as a non-backbone area.  The following Quagga commands (note the slightly different from Cisco syntax) cover the range of 162.168.x.x addresses to operate correctly under OSPF:
network 192.168.0.0/24 area 192.168.0.0
network 192.168.1.0/24 area 192.168.0.0

...
area 192.168.0.0 range 192.168.0.0/16
default-information originate always 
Please note that a separate network definition must be applied for each different subnet the wireless LAN interface encounters.  This requires adding only one command to the Quagga ospfd.conf file each time a new network is encountered.

Since wireless routers assign a static route to the Linux laptop host, it acts as the default gateway originator (OSPF command "default gateway originate always").  This configuration passes the static default gateway from the backbone to connected OSPF areas -- the virtual networks.

Host tap/bridge Interfaces

The numbered host tap/bridge interfaces may be added to the Quagga routing protocols.  For OSPF, assure they are numbered in the Area 0.0.0.0 Backbone range and add their networks accordingly.  These interfaces will then update the host routing tables and any other connected areas.

Guest Interfaces

Three scenarios are depicted in the illustration above:
  1. VMs individually connected to a bridge
  2. QEMU/KVM or VirtualBox Linux router gateway
  3. GNS3 Cisco router gateway

VMs individually connected to a bridge

This is a basic scenario.  The hosts simply need to connect to the tap or bridge interface, have an address in the same subnet and the gateway defined as the host tap or bridge IP address.

QEMU/KVM or VirtualBox Linux router gateway

A VM acting as a gateway to other VMs behind it requires a routing protocol.  One interface must be connected to the host tap or bridge interface and any others connected to one or more bridges for the other hosts.  These additional bridges may be host bridges (as described in this article) or ones defined in the Virtual Networking software used (e.g. QEMU/KVM, VirtualBox, etc.).  Performance of the additional bridges will be the topic of another post.

GNS3 Cisco router gateway

GNS3 on an Ubuntu host is a bit more complicated affair.  Connecting to host networking requires root access (as depicted in the illustrations below), and this has been problematical for the author.

The interfaces are recognized and GNS3 hosts may connect to other VM hosts on the bridge, but not to the host itself.  As described in another article, under Ubuntu the author uses Cloud devices to connect to the host.
GNS3 also is a software emulator and when emulating Cisco IOS hardware-based routers, performance suffers.  Although this test was conducted using an older version of GNS3 (0.86), the author's anecdotal observations of performance of the current (at the time of writing, 1.2.3) indicates low bandwidth routing performance.