Search This Blog

Wednesday, November 12, 2014

Installing Zabbix 2.4 on Debian Wheezy

Zabbix 2.4 is a significant upgrade to Zabbix 2.2.  This post describes some of the enhancements and the simplified installation on Debian Wheezy.

Changes from Zabbix 2.2 to 2.4


A complete list of changes is available in the Zabbix documentation.  A summary of selected improvements includes:
  1. Defining multiple filters for low level discovery
  2. Node-based distributed monitoring removed (Node-based monitoring has been problematical in Zabbix 2.2, possibly due to high bandwidth, low latency requirements)
  3. Ad-hoc graphs for several items
  4. Custom calculation of action conditions
  5. Support of new trigger operators
  6. Web monitoring improvements (custom headers, SSL verification and authentication options, clearing history and trend data)
  7. Optional SNMP bulk requests (as opposed to the previous mandatory)
  8. Graph prototypes supported in screens
  9. Option to remove missing resources when importing
  10. Frontend improvements (unified date and time format, global search by technical name, application filter for maps, URL as dynamic screen element, responsible action shown in action log, description field added to host, host, template and proxy configuration, trigger dependencies shown as links, option to see items only on trigger status page, more options for trigger filtering, maintenance period sorting, host menu changes, regular expression validation, dropping green status icons in listings, changing uploaded image type disallowed, changes regarding multibyte string support, and several more miscellaneous improvements)
  11. Macro improvements
  12. Daemon improvements (LLD, item processing, configuration file handling, including specific items from the Include directory, JSON formatting, log file handling, automaticly discovered host handling, more unsupported item details, database, housekeeper and script result changes and log level at runtime changes)
  13. Item changes/improvements
  14. API improvements
The Zabbix development team has been responsive to user comments and has done a good job of separating Maintenance (included in Zabbix 2.2 updates) from Development (included in the Zabbix 2.4 release).

Installation on Debian Wheezy

The Zabbix 2.2.x package included with Debian Wheezy is not a seamless installation.  There are many manual changes required, as demonstrated in a previous article.  Zabbix 2.4 is not included in Debian Wheezy and the packages must be downloaded from the Zabbix repositories (at http://repo.zabbix.com).  While this may sound like more work, in reality the packages available from the Zabbix repository are better integrated with the apt package management system tan those available from Debian; a great deal of manual configuration is eliminated.

Instructions are available from the Zabbix and this article is drawn heavily from those.


Download and Install the Zabbix Release

Adding a repository to /etc/apt/sources.list is not necessary.  Rather, a release package (downloaded from the Zabbix repository) performs the necessary modifications.

# wget http://repo.zabbix.com/zabbix/2.4/debian/pool/main/z/zabbix-release/zabbix-release_2.4-1+wheezy_all.deb
# dpkg -i zabbix-release_2.4-1+wheezy_all.deb
# apt-get update
 The author installed Debian Wheezy from the boot DVD and specified repositories from the Advanced Installation.  Prior to the package update, the author commented out the line specifying DVD 1 as a source.  This is illustrated in the video at the end of this article.

Install Zabbix Packages

The release package installed above adds the appropriate sources.  Better still, the dependency problems in the Debian distribution packages are solved, eliminating the need to manually specify a long list of packages required for a Debian-version Zabbix 2.2 installation.
# apt-get install zabbix-server-mysql zabbix-frontend-php zabbix-agent postfix
The author installs postfix (replacing the default Debian exim mail MTA); this is optional and included because the author prefers the features in postfix.

During installation, several screens will prompt the administrator to configure Postfix, MySQL and Zabbix.  These are illustrated in the video at the end of this article.

Configure a Time Zone in the Zabbix Frontend PHP Settings

Appropriate PHP settings are included in the installation and installed to /etc/apache2/conf.d/zabbix.  However, the date.timezone value must be manually set by editing that file.  Simply chose an appropriate value from this list.
php_value max_execution_time 300
php_value memory_limit 128M
php_value post_max_size 16M
php_value upload_max_filesize 2M
php_value max_input_time 300
# php_value date.timezone Europe/Riga

Perform the Zabbix Web-Based Installation

Finally, browse to the server's /zabbix directory and perform the web-based installation.  Unlike the installation for the package included with Debian Wheezy, there are no significant manual actions to perform (e.g. manually editing all of the required PHP values and manually adding the frontend configuration file).  Enter the database password specified during the package installations above and the rest is automatic.  The administrator may then log in to the frontend using the default user name "admin" and password "zabbix."

The video below illustrates the entire process.

Thursday, September 11, 2014

Zabbix SNMP Low Level Router Discovery

Using Zabbix SNMP Low Level Discovery to automatically add Cisco Routers, apply Discovery Templates and monitor the devices.


These articles provide additional background on SNMP:
SNMP -- Simple Network Monitoring Protocol for Linux Management Stations
MRTG -- the Multi Router Traffic Grapher
Create the Required Groups

For this model, all of the Discovered routers are Cisco.  Create a Host Group named "Cisco Routers."

Configuring Zabbix Value Mappings

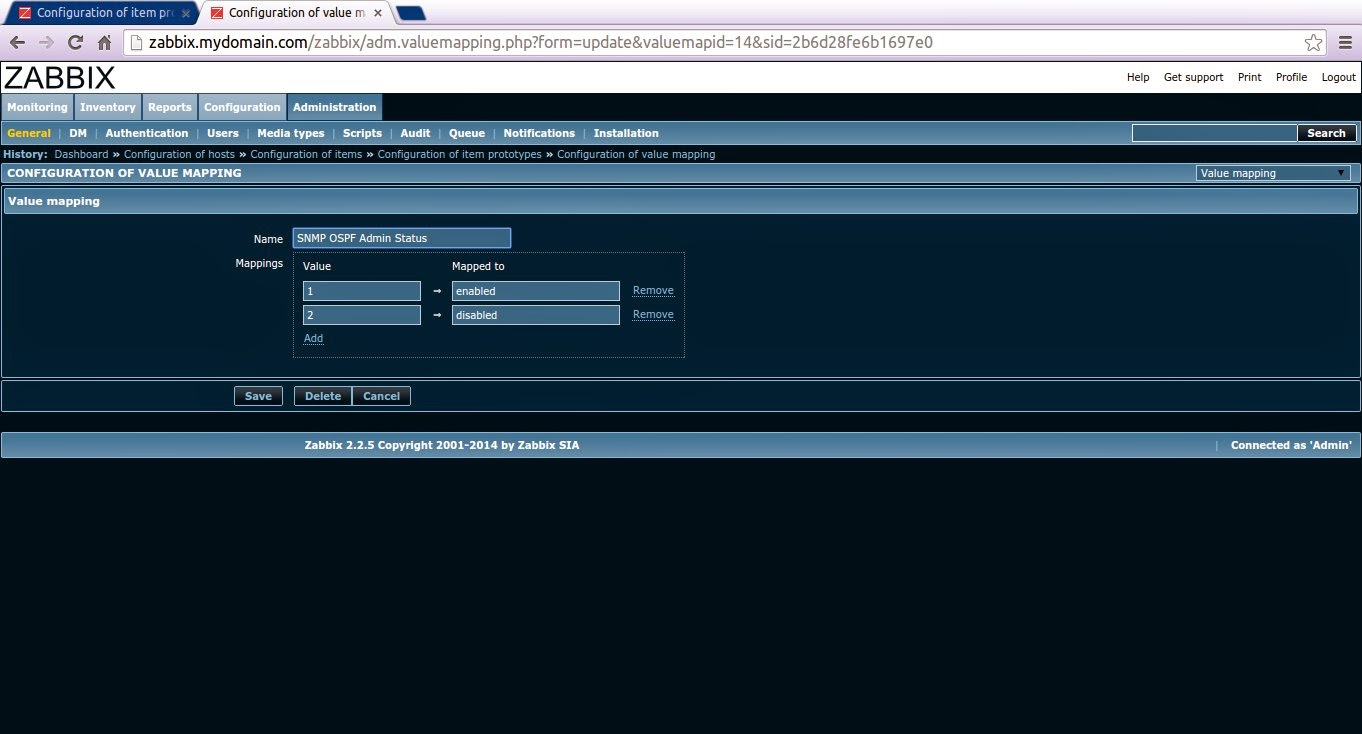
Value Mappings interpret the Values returned by an SNMP query.  The installed SNMP MIB defines a Value List for each relevant OID.  The image below illustrates an snmpwalk for the OSPF MIB's OSPF Area Status OIDs.  Notice the Value List in the lower left.  These values -- and those for other OIDs -- must be mapped in Zabbix prior to importing Template_SNMP_Router_OSPF.  The illustrations below depicts the various Value Mappings that must be configured prior to the OSPF Template import.


Upload the SNMP Discovery Templates

There are three Templates -- on the Zabbix Share -- available at the time of writing:
Template_SNMP_Network_Device_Interfaces
Template_SNMP_Router_Cisco
Template_SNMP_Router_OSPF

Network Device Interfaces Template

This template is generic and will primarily query the IF-MIB tree to develop Interface Item, Trigger and Graph Prototypes.  The Template is valid for any SNMP-compliant networking device -- Layer 1 Hubs, Layer Two and Three Switches and Layer Three Routers.  This article adds Discovery functionality using other Templates and the same may be done for other vendor's equipment.

Cisco SNMP Router Template

This Template will query OIDs under proprietary Cisco MIBs.  This may be problematical for routers running older versions of the Cisco IOS because the SNMP implementations have changed over time.  The Template queries CPU and Memory utilization for recent IOS versions.  It is assumed the Zabbix Server has stock MIBs installed (for instance, the snmp-mibs-downloader MIBs available under Debian Wheezy), but since the Cisco MIBs are proprietary and require additional Zabbix Server SMP configuration, they are queried by numerical OID and not by human-readable text.

OSPF SNMP Router Template

This template is generic and will primarily query the OSPF-MIB tree to develop Item, Trigger and Graph Prototypes.   The Template is valid for any SNMP-compliant OSPF implementation.

Items

Items are single-instance OIDs unique to each device.

Triggers

Triggers use Items and are also derived from single-instance OIDs unique to each device.

Discovery


Discovery is a dynamic and variable process.  Essentially, the Discovery Item queries a single part of the MIB tree using the snmpwalk command.  This query returns a series of Indexes and Values for the MIB tree.  For instance, the snmpwalk query:
$ snmpwalk -v 2c -c public 172.16.0.1 IF-MIB::ifDescr
IF-MIB::ifDescr.1 = STRING: POS3/0
IF-MIB::ifDescr.2 = STRING: POS4/0
IF-MIB::ifDescr.3 = STRING: POS5/0
IF-MIB::ifDescr.4 = STRING: FastEthernet0/0
IF-MIB::ifDescr.5 = STRING: Serial1/0
IF-MIB::ifDescr.6 = STRING: Serial1/1
IF-MIB::ifDescr.7 = STRING: Serial1/2
IF-MIB::ifDescr.8 = STRING: Serial1/3
IF-MIB::ifDescr.9 = STRING: Serial2/0
IF-MIB::ifDescr.10 = STRING: Serial2/1
IF-MIB::ifDescr.11 = STRING: Serial2/2
IF-MIB::ifDescr.12 = STRING: Serial2/3
IF-MIB::ifDescr.13 = STRING: FastEthernet6/0
IF-MIB::ifDescr.14 = STRING: FastEthernet6/1
IF-MIB::ifDescr.15 = STRING: Null0
The format used by Zabbix is
IF-MIB::ifDescr.[INDEX] = STRING: [VALUE]

These INDEX and VALUE returns are passed to Prototypes, which define specific instances.

Item Prototypes


Item Prototypes use the INDEXES and VALUES returned from the Discovery Rule to perform snmpwalk commands on single, specific OID's.  The format of the snmpwalk commands are:
OID.{#SNMPINDEX}
The OID value is specific to each Itemp Prototype definition.

The Key is assigned as a text string to which the [{#SNMPVALUE}] variable is appended.  This Value also passes to the Name using the $1 variable.

Trigger Prototypes


Trigger Prototypes are defined in the same manner as Triggers.  They may use Items or Item Prototypes.

Graph Prototypes

Graph Prototypes are defined in the same manner as Triggers.  They use Item Prototypes.

Discovery Rule(s)

Discovery Rules define the Network Discovery process.  These are covered in this article.

For this Template, define the address range(s) on which routers are found.  There are two checks:

SNMPv2-MIB::sysDescr.0
SNMPv2-MIB::sysName.0
The first, System Description, will return a description that includes general system information, including the manufacturer's name.  The second, System Name, will return (if configured correctly) a unique name assigned to the device.  This unique name is then used to define the Zabbix "Device uniqueness criteria," and will only add the device once, even though it will likely be discovered by several interfaces.

Name

Assign the Name Cisco Routers.

IP Range

Assign as many subnets as necessary to include device IP addresses.  You may subnet these values to search only a portion of the desired subnet.  For instance, if there is a network subnet 10.64.0.0/24 that can accommodate 254 hosts, you may define the Zabbix Discovery IP address range as (for example) 10.64.0.0/28 to only search the lower portion of the subnet's available IP addresses.

Checks

The Checks are used primarily to define device uniqueness (SNMPv2-MIB::sysName.0 as described above) and for passing information to Actions (SNMPv2-MIB::sysDescr.0 as descibed above); Actions are described below.

Device Uniqueness

For a given Discovery Rule, a device -- particularly switches and routers -- may have several interfaces that will show up in Discovery.  Uniqueness definitions assure they will only be added once and that each device has all interfaces encountered by the Discovery Rule included.

Action(s)

Actions instruct Zabbix what to do when an event occurs (Trigger, Discovery, etc.).  For a Network Discovery, the goal is to add and configure each device automatically.  Discovery Prototypes take care of the configuration; Actions take care of adding the device for monitoring.

Action

Create a new Discovery Action named "Cisco Routers."

Conditions


Define Conditions that filter Discovered devices.  Keep in mind interfaces other than Networking Devices may be discovered; we don't want to monitoring these as Cisco Routers.
Received value like Cisco   
Discovery status = Up   
Service type = SNMPv2 agent
The Received value Condition will filter out any device that does not include "Cisco" in the returned Discovery Rules Values (SNMPv2-MIB::sysDescr.0 and SNMPv2-MIB::sysName.0).  The other Conditions are added to make sure we only add UP devices that are responding to SNMP.

Operations


Finally, the device will be added to a Host Group (Cisco Routers) and linked to Templates.
Add to host groups: Cisco Routers
Remove from host groups: Discovered hosts
Link to templates: Template SNMP Network Device Interfaces, Template SNMP Router Cisco, Template SNMP Router OSPF
Linking to Templates assigns the Discovery Rules, etc. that will periodically query and define the device.

Discovered Devices

The Discovery process will not recognize the device's host name and it will be added with the first discovered IP address as the host name.  The host name must be manually modified after Discovery and Actions.

Below is a video that illustrates the Zabbix SNMP LLD Router Discovery process.


Monday, September 8, 2014

MRTG -- the Multi Router Traffic Grapher

A functional overview of the Multi Router Graphing Tool (MRTG) using 8 virtual Cisco Routers and one virtual Linux router.

MRTG is a tool to automate collection and presentation of router -- or any network device -- interface utilization.  It uses SNMP to query interfaces for name, configuration and performance information, creates log files and graph images and organizes them as web pages.  MRTG development commenced in 1994 and has been available since the mid 1990's.  It has a long history of reliable performance and has been improved over the years; the author has used it since approximately 2000 and has not experienced significant problems (at least ones that weren't his own fault).

There are several important components to understand:
  1. The cfgmaker command line data collection configuration utility
  2. Log and image files and resulting per host-interface web pages
  3. The indexmaker command line index web page configuration utility


MRTG CFGMAKER

MRTG provides a command line tool -- cfgmaker -- that automates walking target MIBs and preparing the MRTG configuration file.  The bulk of what cfgmaker searches is in the iso.org.dod.internet.mgmt.mib-2.interfaces.ifTable.ifEntry MIB (1.3.6.1.2.1.2.2.1).  The shorthand way to address interface SNMP information is to invoke IF-MIB::<value> at the command line.  For instance,
snmpwalk -v 2c -c public <host> IF-MIB::ifIndex
The cfgmaker command also is capable of addressing a limited number of other proprietary MIBs, which we will see below.


For this example, the following command is used:
$cfgmaker --no-down --show-op-down --ifdesc=descr,ip public@cou-gateway public@7206_COU_01 public@7206_PHL_01 public@7206_PIT_01 public@7206_HBG_01 public@3640_WEL_01 public@3745PHL_01 public@2691_ALT_01 public@3725_YRK_01 --output /etc/mrtg/mrtg.cfg
where:
--no-down and --show-op-down:  includes operationally and administratively down interfaces in the configuration and does not comment them out.--ifdesc=descr,ip:  uses the SNMP ifDescr or IP address as the MRTG Interface description.<community>@host ... : SNMP Community@Host Name combination for a list of hosts.--output /etc/mrtg/mrtg.cfg: Write the output to the specified file.
As the command processes, it outputs information to the terminal:
--base: Get Device Info on public@3725_YRK_01:--base: Vendor Id: cisco--base: Populating confcache--base: Get Interface Info
--base: Walking ifIndex--snpd:   public@3725_YRK_01: -> 1 -> ifIndex = 1--snpd:   public@3725_YRK_01: -> 2 -> ifIndex = 2--snpd:   public@3725_YRK_01: -> 3 -> ifIndex = 3...--snpd:   public@3725_YRK_01: -> 22 -> ifIndex = 22
--base: Walking ifType--snpd:   public@3725_YRK_01: -> 1 -> ifType = 6--snpd:   public@3725_YRK_01: -> 2 -> ifType = 22--snpd:   public@3725_YRK_01: -> 3 -> ifType = 6...--snpd:   public@3725_YRK_01: -> 22 -> ifType = 6
--base: Walking ifAdminStatus--snpd:   public@3725_YRK_01: -> 1 -> ifAdminStatus = 2--snpd:   public@3725_YRK_01: -> 2 -> ifAdminStatus = 1--snpd:   public@3725_YRK_01: -> 3 -> ifAdminStatus = 2...--snpd:   public@3725_YRK_01: -> 22 -> ifAdminStatus = 2
--base: Walking ifOperStatus--snpd:   public@3725_YRK_01: -> 1 -> ifOperStatus = 2--snpd:   public@3725_YRK_01: -> 2 -> ifOperStatus = 1--snpd:   public@3725_YRK_01: -> 3 -> ifOperStatus = 2...--snpd:   public@3725_YRK_01: -> 22 -> ifOperStatus = 2
--base: Walking ifMtu--snpd:   public@3725_YRK_01: -> 1 -> ifMtu = 1500--snpd:   public@3725_YRK_01: -> 2 -> ifMtu = 1500--snpd:   public@3725_YRK_01: -> 3 -> ifMtu = 1500...--snpd:   public@3725_YRK_01: -> 22 -> ifMtu = 1500
--base: Walking ifAlias--snpd:   public@3725_YRK_01: -> 1 -> ifAlias =
--snpd:   public@3725_YRK_01: -> 2 -> ifAlias =
--snpd:   public@3725_YRK_01: -> 3 -> ifAlias =
...--snpd:   public@3725_YRK_01: -> 22 -> ifAlias =

--base: Walking vmVlan--snpd:   public@3725_YRK_01: -> 5 -> vmVlan = 1--snpd:   public@3725_YRK_01: -> 6 -> vmVlan = 1--snpd:   public@3725_YRK_01: -> 7 -> vmVlan = 1...--snpd:   public@3725_YRK_01: -> 20 -> vmVlan = 1
--base: Walking vlanTrunkPortDynamicStatus--base: Walking ifSpeed--snpd:   public@3725_YRK_01: -> 1 -> ifSpeed = 10000000--snpd:   public@3725_YRK_01: -> 2 -> ifSpeed = 1544000--snpd:   public@3725_YRK_01: -> 3 -> ifSpeed = 10000000...--snpd:   public@3725_YRK_01: -> 22 -> ifSpeed = 100000000
--base: Writing mrtg.cfg
The first step cfgmaker performs is walking ifIndex.  This returns a unique value (in this case 1 through 22) assigned to each network interface -- ifIndex.# = #.  This value is important because it is then passed to subsequent snmpwalk commands to generate interface-specific values for the MRTG configuration file.  It then uses sequential snmpget commands to retrieve the type of interface.  These sequential commands are in the format IF-MIB::ifType.# where # begins with 1 and ends with 22.  This returns a numerical value assigned according to SNMP RFCs:
other (1)
regular1822 (2)

hdh1822 (3)
ddnX25 (4)
rfc877x25 (5)
ethernetCsmacd (6)
...
basicISDN (20)
primaryISDN (21)
propPointToPointSerial (22)
ppp (23)
...
x86Laps (242)
wwanPP (243)
wwanPP2 (244)
For this router, there are Ethernet (6) and serial (22) interface types.

The cfgmaker process then reads ifAdminStatus.#, ifOperStatus.#, ifMtu.#, ifAlias.#, and ifSpeed.# values in the same format.  The vmVlan walk is a bit different.  This is a Cisco proprietary MIB value (1.3.6.1.4.1.9.9.68.1.2.2.1.2) hard-coded into cfgmaker and is not directly tied to interfaces.  It each entry is keyed to interface ID (ifIndex) in the format vmVlan.ifIndex and the returned value is the VLAN ID.  This only applies to switched ports, in this case a 16-port NM-16ESW card (ifIndex 5 through 20) in the Model 3725 Router chassis.


The process continues for all hosts specified in the host list.

MRTG Cron Job

MRTG may run as a daemon or be called by a cron job.  In the author's experience, it is more reliable running as a 5-minute cron job, /etc/cron.d/mrtg:

0-55/5 * * * * root if [ -x /usr/bin/mrtg ] && [ -r /etc/mrtg.cfg ]; then env LANG=C /usr/bin/mrtg /etc/mrtg.cfg >> /var/log/mrtg/mrtg.log 2>&1; fi

This cron job outputs daily, weekly, monthly and yearly .html pages, .png images and .log log files for each interface, named by host-interface combination.

Log Files

Log files are organized by host-interface pair.  They maintain timestamped interface bandwidth utilization data. The MRTG cron job then uses these data to generate graph images and bandwidth utilization statistics.  These log files automatically rotate, limiting the size maintained.


Image Files

Image files are generated by the MRTG cron job calling rrdtool to create the image from the log files.  They are created for each host-interface pair's daily, weekly, monthly and yearly data.


RRDTool

RRDTool -- as utilized by MRTG -- creates images of data collected by MRTG.  It maintains database files in the .rrd format.

Web pages

The web pages organize each host-interface pair's information, including interface name, address, descriptive data, and daily, weekly, monthly and yearly graphs with current, average and maximum bandwidth utilization.

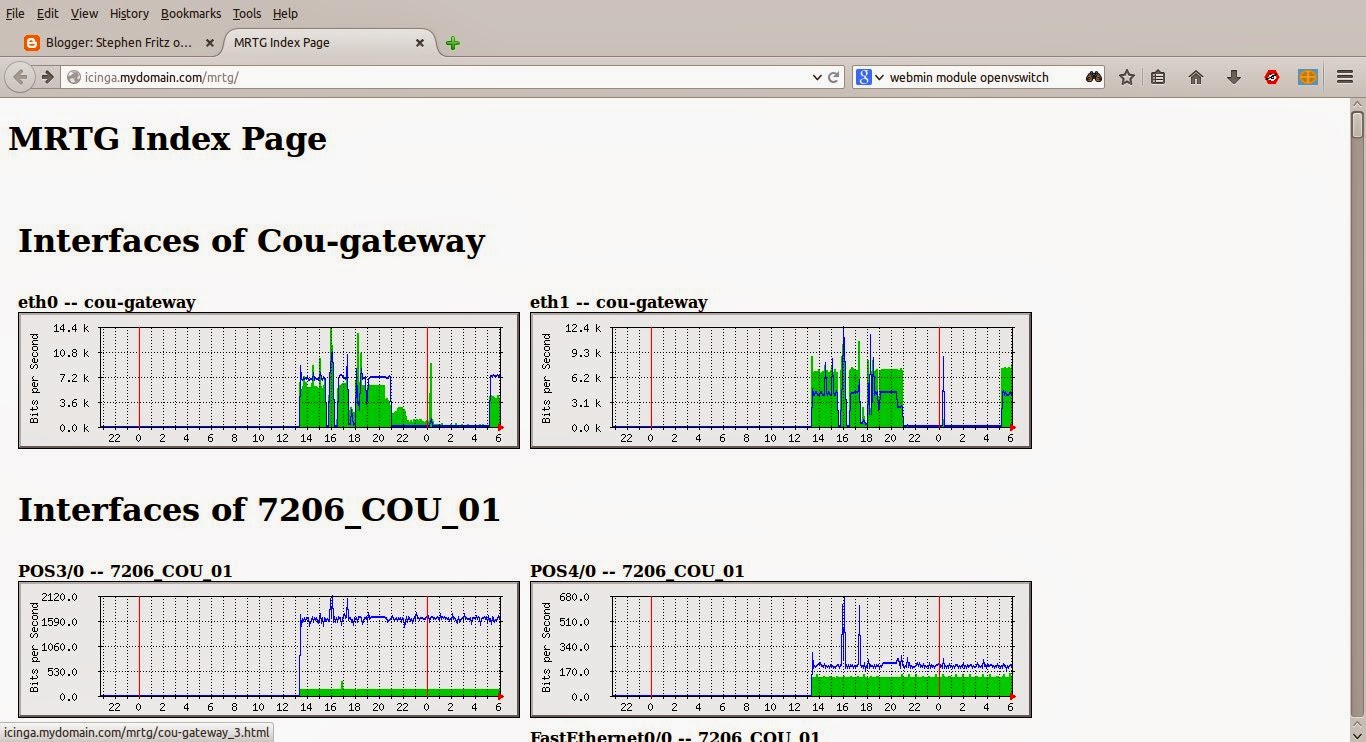
The Index Page (left) is a summary of the monitored host-interface pairs that provides a daily traffic image.  In this case, it is organized by host (Interfaces of <host name>) and titled by Interface name (interface name - host name). The daily, 5-minute time-weighted image is linked to more detailed interface information: daily, weekly, monthly and yearly graphs and statistics.

MRTG INDEXMAKER

MRTG provides a command line tool -- indexmaker -- that automates generating the static index.html MRTG start page.  This page is a summary of host and interface data that is hyperlinked to more detailed web pages and images described above.  The index.html file used in this article was generated using the command:
$indexmaker /etc/mrtg/mrtg.cfg --output=/var/www/mrtg/index.html --section=title --perhost
where:--output=/var/www/mrtg/index.html: the location and name of the output file.--section=title: Uses titles to delimit sections.--perhost:  organizes sections by host.

Sunday, September 7, 2014

SNMP -- Simple Network Management Protocol for Linux Management Stations

An article describing the SNMP protocol and the Linux command-line and graphical tools to use it for network monitoring application.

The Simple Network Monitoring Protocol is a standardized, hierarchical system of querying, storing retrieving and modifying device and software information. It is used to obtain information about a device (for instance its hardware configuration) and retrieve performance data over time (for instance, memory used, processor load, network interface traffic). The open, standardized format provides a framework management applications may easily use to collect, interpret and display trend analysis and alerting information. This article will describe the common elements of SNMP and several utilities available under Linux to view and query SNMP data. These skills are important for those who wish to implement SNMP applications in the enterprise.

SNMP Structure


SNMP consists of three logical components:
  1. Managed Devices -- the hardware - software to be monitored
  2. Agents -- software installed on Managed Devices
  3. Network Management Stations -- software that runs on one or more devices monitoring the Managed Devices and Agents

SNMP Managed Devices and Agents


Agents periodically measure and store specific local hardware and software information on the Managed Device. The information is stored in numerically-hierarchical tables known as the SNMP Management Information Base (MIB). SNMP MIBs are hierarchical and extensible with a structure confirming to RFC 2578. Agents store the data associated only with the numerical representation of the MIB -- an nomenclature known as the Object Identifier (OID). The Network Management Station queries the OIDs of interest and then -- using add-on textual MIBs -- associates the numerical MIB value with a human-readable one. The Network Management Station does not necessarily require installation of textual MIBs to operate; it may still query the numerical MIBs, but it will not be able to search the MIB hierarchy by human-readable text. Realistically, textual MIBs are necessary.

The Agent MIBs maintained by Managed Devices are generally not static. When you add and remove hardware (or SNMP-compliant software), the MIBs will change to reflect changes on the Managed Device. For instance, if you add memory, disks and NICs to a server, the MIBs will add entries (sometimes many) to monitor the new hardware.

Security, as a generalization, includes read and write privileges. The security settings include groups (Read-Only and Read-Write) and users (members of Read Only and Read-Write). The generally-accepted default read-only security group is named "public." Needless to say, this is a significant security problem because it allows read access to an enormous amount of information. This should be changed in a production environment, but this article will use the default value. Read-Write users may modify MIBs using commands such as "snmpset." Write access to the MIBs is beyond the scope of this article.

Agents may also automatically forward information to specified Network Management Stations using SNMP Traps. These are useful for time-sensitive alerts or forwarding information only when it changes. For instance, the IP address of a network interface will remain constant for a very long time. A trap may be configured to forward a change of address only when it occurs, relieving the Network Management Station of the burden of periodically querying (generally) static information.

The highest levels of the MIB standard nomenclature include:
iso = 1
iso.std = 1.0
iso.member-body = 1.2
iso.org = 1.3

iso.org.dod = 1.3.6
iso.org.ieee = 1.3.111

iso.org.dod.internet = 1.3.6.1

iso.org.dod.internet.directory = 1.3.6.1.1
iso.org.dod.internet.mgmt = 1.3.6.1.2
iso.org.dod.internet.experimental = 1.3.6.1.3
iso.org.dod.internet.private = 1.3.6.1.4

In practical usage, much information of interest is located under the structure iso.org.dod.internet.mgmt.mib-2, whose numerical OID is:

iso.org.dod.internet.mgmt.mib-2 = 1.3.6.1.2.1

The numerical and nomenclature hierarchy continues under this OID.

system = 1.3.6.1.2.1.1
system.sysDescr = 1.3.6.1.2.1.1.1
system.sysObjectID = 1.3.6.1.2.1.1.2
system.sysUpTime = 1.3.6.1.2.1.1.3
system.sysUpTime.sysUpTimeInstance = 1.3.6.1.2.1.1.3.1

interfaces = 1.3.6.1.2.1.2
interfaces.ifNumber = 1.3.6.1.2.1.2.1
interfaces.iftable = 1.3.6.1.2.1.2.2
interfaces.ifTable.ifEntry = 1.3.6.1.2.1.2.2.1
interfaces.ifTable.ifEntry.ifIndex = 1.3.6.1.2.1.2.2.1.1
interfaces.ifTable.ifEntry.ifDescr = 1.3.6.1.2.1.2.2.1.2
...

ospf = 1.3.6.1.2.1.14
ospf.ospfGeneralGroup = 1.3.6.1.2.1.14.1
ospf.ospfGeneralGroup.ospfRouterID = 1.3.6.1.2.1.14.1.1
ospf.ospfGeneralGroup.ospfAdminStat = 1.3.6.1.2.1.14.1.2

The above MIB strucutres are an example of open, standardized MIBs that are applicable across all platforms. There are also vendor- and group- specific MIBs, generally located under iso.org.dod.internet.private.enterprises:

iso.org.dod.internet.private.enterprises = 1.3.6.1.4.1
iso.org.dod.internet.private.enterprises.ibm = 1.3.6.1.4.1.2
iso.org.dod.internet.private.enterprises.cisco = 1.3.6.1.4.1.9
iso.org.dod.internet.private.enterprises.atmForum = 1.3.6.1.4.1.353

Linux SNMP Management Station Utilities


There are two general categories of tools important for using Linux as a Network Management Station: MIBs and SNMP applications.

Linux MIBs


MIBs are proprietary, so check your local laws before installing them. Under Debian, the SNMP-MIBs-Downloader package provides a set of useful MIBs, generally standardized and cross-platform, located under the iso.org.dod.internet.mgmt.mib-2 = 1.3.6.1.2.1 hierarchy. Under Debian, install the package (apt-get install snmp-mibs-downloader) and issue the command download-mibs to retrieve the default-configured packages. Once the packages are retrieved, you must modify the /etc/snmp.conf file to read them. Comment out the default mibs : line and add mibs +ALL:


cat /etc/snmp/snmp.conf

# As the snmp packages come without MIB files due to license reasons, loading
# of MIBs is disabled by default. If you added the MIBs you can reenable
# loading them by commenting out the following line.
#mibs :
mibs +ALL

The Downloader configuration files are stored in the /etc/snmp-mibs-downloader directory as a configuration file and a list file for each source. For instance, the RFC MIBs are configured through the files rfc.conf and rfclist:


$ cat /etc/snmp-mibs-downloader/rfc.conf
# Configuarions for IETF MIBs download from rfc-editor.org
#
#HOST=http://www.rfc-editor.org
#DIR=rfc
DIR=/usr/share/doc
ARCHIVE=mibrfcs
ARCHTYPE=dirgz
CONF=rfclist
DEST=ietf
DIFF=rfcmibs.diff
PREFIX=rfc
SUFFIX=.txt

$ cat /etc/snmp-mibs-downloader/rfclist
# updated 2010-06-05
1155 RFC1155-SMI
1213 RFC1213-MIB
1227 SMUX-MIB
1238 CLNS-MIB
...

SNMP-MIBs-Downlaoder is not limited to the distribution default sources. For example, you may download Cisco's vendor MIBs by adding a cisco.conf and ciscolist file.

$ cat /etc/snmp-mibs-downloader/cisco.conf
HOST=ftp://ftp.cisco.com
ARCHIVE=v2.tar.gz
ARCHTYPE=tgz
DIR=pub/mibs/v2/
ARCHDIR=auto/mibs/v2
CONF=ciscolist
DEST=cisco

$ cat /etc/snmp-mibs-downloader/ciscolist
ADMIN-AUTH-STATS-MIB.my ADMIN-AUTH-STATS-MIB
ADSL-DMT-LINE-MIB.my ADSL-DMT-LINE-MIB
...

Linux Applications


The most basic Debian Linux applications are SNMP (the application) and SNMPD (the Agent Daemon). SNMP provides command-line Network Management Station utilities and SNMPD provides the Agent to monitor the Linux machine as a Managed Device. More advanced Linux Network Management Station applications generally use the base utilities installed by SNMP.

The Net-SNMP package several provides command-line utilities under /usr/bin:

~$ ls /usr/bin/snm*

This article is only going to examine two: snmpget and snmpwalk.


SNMPGET


SNMPGET is the utility that retrieves a single MIB entry. The following three snmpget commands are examples of querying a MIB using SNMP Version 2c (-v 2c) and the Community public (-c public) by numeric OID, the full textual MIB reference and using the -n switch to set the MIB context (-n system):


$ snmpget -v 2c -c public localhost -n system 1.3.6.1.2.1.1.1.0
SNMPv2-MIB::sysDescr.0 = STRING: Linux SEFLaptop 3.13.0-35-generic #62-Ubuntu SMP Fri Aug 15 01:58:42 UTC 2014 x86_64

$snmpget -v 2c -c public localhost iso.org.dod.internet.mgmt.mib-2.system.sysDescr.0
SNMPv2-MIB::sysDescr.0 = STRING: Linux SEFLaptop 3.13.0-35-generic #62-Ubuntu SMP Fri Aug 15 01:58:42 UTC 2014 x86_64

$ snmpget -v 2c -c public localhost -n system sysDescr.0
SNMPv2-MIB::sysDescr.0 = STRING: Linux SEFLaptop 3.13.0-35-generic #62-Ubuntu SMP Fri Aug 15 01:58:42 UTC 2014 x86_64

SNMPWALK


SNMPWALK is similar to snmpget, but it retrieves all available values under the specified context. Using the context above (system), snmpwalk retrieves all values stored:
$ snmpwalk -v 2c -c public localhost system
SNMPv2-MIB::sysDescr.0 = STRING: Linux SEFLaptop 3.13.0-35-generic #62-Ubuntu SMP Fri Aug 15 01:58:42 UTC 2014 x86_64
SNMPv2-MIB::sysObjectID.0 = OID: NET-SNMP-TC::linux
DISMAN-EVENT-MIB::sysUpTimeInstance = Timeticks: (5397099) 14:59:30.99
SNMPv2-MIB::sysContact.0 = STRING: Me <me@example.org>
SNMPv2-MIB::sysName.0 = STRING: SEFLaptop
SNMPv2-MIB::sysLocation.0 = STRING: Sitting on the Dock of the Bay
SNMPv2-MIB::sysServices.0 = INTEGER: 72
...
This is useful for enumerating variables that may be passed by automation in more advanced SNMP Management Station applications such as Multi Router Traffic Grapher and Zabbix. Thise applications are beyond the scope of this article.

Graphical SNMP MIBs Viewers

Linux provides several graphical SNMP Mib Viewers such as tkmib and SNMPB. While it is possible to query Agent MIBs by OID and return useful information to Management Applications, in real-world situations it is impratical to do so. You must have textual MIBs installed to make sense of the OIDs; a graphical browser also saves a lot of time searching for usable information compared to command-line utilities.


SNMPb


The default installation under Debian utilizes the MIBs downloaded by SNMP-MIBs Downloader and others installed by the application itself under different directories. If yu have added additional MIBs - such as the Cisco MIBs described above -- you must modify the paths (under the application's Options > Preferences > Modules) SNMPB uses to load MIBs. SNMPB then provides a single-click interface to issue commands such as Walk, Get, Getnext, Getbulk and Set.

Once you have installed and configured SNMPB, it is much easier to search MIBs, particularly the standardized, cross-platform ones under iso.org.dod.internet.mgmt.mib-2 (OID 1.3.6.1.2.1). Vendor MIB structures may be organized differently than mib-2. Cisco under private.enterprise at OID 1.3.6.1.4.1.9) is an example. There are hundreds of OID groups under the ciscoMgmt (1.3.6.1.4.1.9.9) MIB and a graphical interface is almost required to search for usable information.

Tuesday, August 12, 2014

Nagios/Icinga Exchange 2010 Performance Monitoring

This article describes Exchange 2010 Nagios/Icinga Templates that monitor various Exchange Roles:  Common Services, Mailbox, Hub Transport and Client Access Servers.  While built specifically for those systems, it is likely  the Templates are also compatible with other Exchange versions.

For those with Nagios/Icinga and Windows experience, the counters used are available from the Monitoring Exchange page.

Elements of an Exchange Enterprise
 

Windows Performance Monitor

Windows Server ships with a excellent monitoring and trend analysis tool: Performance Monitor.  As illustrated below, it allows administrators to select and graph counters that include list of system metrics.  These measurements may also be saved as delimited text files for future analysis and visualization.  A centralized server may connect to other servers to remotely collect data.  Since the API is well-documented, it is integrated into other value-added systems monitoring software.


Windows Server Performance Monitor


Selecting Windows Server Performance Monitor Counters

The illustration below depicts the text format of a Windows Performance Monitor counter.  Commands conforming to this syntax may be sent from remote monitoring servers whose applications comply with the Windows API.
Displaying Windows Server Performance Monitor Syntax

Exchange 2010 Management Console

The Exchange Management Console (EMC) provides another set of tools to monitor and diagnose Exchange performance.  Many of the screens are overviews that offer sets of Powershell-scripted tools to manage the enterprise.

The EMC Toolbox offers a set of more detailed management and monitoring tools such as Message and Queue Tracking, Log Viewers and preconfigured Performance Monitor and Troubleshooter screens.
These tools are valuable and (for the most part) provide a centralized console for enterprise management.  However, Nagios/Icinga is centralized and can collect information that may be displayed in customizable formats.  Nagios/Icinga also automates may of the visualization and presentation tasks in a far more flexible way.

Prerequisites

A thorough knowledge of Nagios/Icinga installation and configuration is necessary.  The fundamental knowledge to Nagios/Icinga is presented in the following articles:
Nagios/Icinga Installation and Initial Configuration
Nagios/Icinga Database Integration
Nagios/Icinga Configuration Files
Nagios / Icinga Configuration with NConf - a Graphical Web / Database Tool

Nagios / Icinga Performance Data Graphing with PNP4Nagios


Information specific to Windows Server enterprise monitoring is presented in these two articles:

Nagios/Icinga Templates for Windows 2008 R2 OS, Domain Controllers, DNS and IIS Servers 

Automated Nagios/Icinga NSClient++ Deployment and Configuration for Windows Enterprises


Overview of Exchange 2010 Roles


Exchange Server 2010 allows the administrator to install different roles.
  1. Mailbox Role (Mandatory)
  2. Hub Transport Role (Mandatory)
  3. Client Access Server Role (Mandatory)
  4. Unified Messaging Server Role (Optional)
  5. Edge Transport Role (Optional and Unique)
The first three roles must be present in the enterprise. They may be deployed on a single server or deployed individually or in combination on multiple servers.  The Unified Messaging role is optional; the Edge Transport Role is also optional and (if installed) no other roles may be present.  A more detailed description of Exchange 2010 Roles is available in the article Exchange 2010 Architecture.


The templates for each Role/Role Service/Feature set monitor the availability of services using both NRPE Windows service checks to query the OS and check_tcp or check_udp plugins to query the NIC TCP/UDP  For instance, you may use NRPE to query the "Microsoft Exchange IMAP Service" and the check_tcp plugin to check the associated TCP services on ports 143 (IMAP) and 993 (IMAPS) to determine if the IMAP Mailbox Access service is available.

There is still another set of definitions for Templates -- information important for day-to-day monitoring and information important for troubleshooting, trend analysis and scalability design.  The second set includes primarily Performance Counters.  Thus, for each set of Exchange data collected, there is a standard set of data including Application service checks, TCP service checks and Performance Counters and a second, more detailed set that includes primarily Performance Counters.  Flowing from the examples above, the "Exchange 2010 Client Access Server" Template would provide important day-to-day triggers and performance information while a second, "Exchange 2010 Client Access Server  Performance Counters" provides highly detailed data for troubleshooting, trend analysis, etc.


Description of Monitored Exchange 2010 Services and Counters

Counter Overview


Nagios/Icinga use Check Commands and Service Checks to monitor Windows.  They use an NRPE Windows Services check to determine if all automatically started and disabled services are in their proper state. They use NRPE Windows Performance Monitoring Counter checks to monitor various aspects of the Exchange Server Roles.  Finally, they use TCP Service Checks to determine if services are available to the network.

Baseline Windows Server Service Checks are available for download from the Monitoring Exchange site. These checks were gathered from a variety of Microsoft sources and provide details of basic Processor, Memory, Disk and Network utilization statistics that are fundamental to systems monitoring. 

Each Exchange Server Role (Mailbox, Hub Transport and Client Access) have their own set of templates for both standard, day-to-day monitoring and more complete Performance Monitoring for detailed performance, trend and capacity planning analyses.  These are available at:
Exchange Common Services 
Exchange Mailbox Services 
Exchange Hub Transport Services 
Exchange Client Access Services


Host Group Assignments

The counters are intended to be associated with Host Groups for deployment.  Each Host is then assigned to the appropriate Host Group, at which point the counters become active.  These include:

  1. exchange-common-servers
  2. exchange-common-servers-perfmon
  3. exchange-mailbox-servers
  4. exchange-mailbox-servers-perfmon
  5. exchange-hubtransport-servers
  6. exchange-hubtransport-servers-perfmon
  7. exchange-cas-servers
  8. exchange-cas-servers-perfmon
Again, once created, applying the checks now requires no more than adding the host to the appropriate groups.

Service Group Assignments 

Service Groups provide a logical grouping of hosts that each monitor specified Service Checks.  They are created by assigning specified Service Checks to the Service Group, after which Nagios/Icinga will include the appropriate Hosts.  This will necessarily include overlapping Hosts and Host Groups within defined Service Groups because Exchange services are not necessarily unique to each Role.  For instance, monitoring Outlook Web Access (OWA) requires monitoring web-based services.  While we associate OWA with Client Access Servers, some of these services are common to all Exchange Roles and (in fact) necessary for end-to-end OWA conectivity throughout the Exchange Enterprise; web-based services must be functioning on Hub Transport and Mailbox Role Servers for OWA to properly work.  This is a good thing; OWA will fail if the web services on Mailbox and Hub Transport Servers are not working correctly and such a definition of the Service Group provides a complete view of the required counters.


PNP4Nagios and NagVis Integration

Web-based monitoring using the default applications is helpful, however additional visualizations provide an easier to understand overview and facilitate more rapid troubleshooting.


PNP4Nagios is an add-on that provides performance graphing.  While useful for identifying immediate issues (such as overloaded mail queues), it is even more so for identifying issues before they happen -- trend analysis.  For instance, you check mail queue performance, disk and network activity to identify the specific Hub Transport and Mailbox servers that are approaching excessive mail message capacity.  The need for added capacity may thus be identified in advance so that a planned upgrade specified and implemented before system performance degrades.

NagVis is another visualization add-on that provides a map-like or diagram-like interface.  The selection of information is limited only by that available in Nagios/Icinga, ranging from generalized overviews to highly-detailed (Service Check specific) information.  The examples provided show Host and Service Groups status for the Enterprise.


Example

The video below depicts a Nagios/Icinga Exchange Enterprise monitoring in operation.  Also included are examples of PNP4Nagios and NagVis.