Search This Blog

Thursday, June 19, 2014

Windows Server Performance Monitoring with Munin

Using Munin to collect Windows Server Performance Counters comes down to this: knowing the important Windows Performance Monitoring counters and adding the to the munin-node.ini file in the proper format.  Below s the Processor\% C1 Time counter (a low-power state) and the .ini file entry that produces the graph.


[PerfCounterPlugin_Processor%C1Time]
Object=Processor Information
Counter=% C1 Time
GraphTitle=% C1 Time
GraphCategory=processor
DropTotal=1
GraphDraw=LINE
GraphArgs=--base 1000 --lower-limit 0
CounterFormat=double
CounterMultiply=1.000000

That's all it takes to produce daily, weekly, monthly and annual graphs for a counter.  Lather, rinse and repeat as often as you like.

Installing the Windows Munin Agent

This topic is covered in another Munin article.  At the time of writing, the installation package is available here.

Configuring the Windows Munin Agent

Windows Performance Monitoring commands are defined in the agent munin-node.ini file, not on the server.  Each counter is defined by a set of commands that define three things:  name, Windows Performance Counter and graph display properties.

Name

[PerfCounterPlugin_<name>] 
is the format used.  Simply insert a name that adequately describes the counter.

Windows Performance Counter

Object=<windows counter group object>
Counter=<windows counter item>
DropTotal=<0 or 1>

The first two entries define the counter to be collected.  Munin does not require quotes or special formatting to interpret the counters.  Needless to say, Windows provides hundreds of individual counters from which to choose.  The most difficult part of the process is selecting a set of counters that adequately monitors all of the important subsystems of interest.  For instance, hardware limitations include Processor Item, Memory, Disk and Network counters.  Server limitations (e.g. Microsoft SQL Server) also include application layer counters that define configuration errors.

DropTotal instructs the agent to drop the last counter when a set of items appear under a counter.  For instance, in a multiprocessor server, the individual items include Processor 0, Processor 1, Processor 2... and finally Processor _Total.  The last item Windows collects (Processor _Total in this case) may or may not be of interest.  If you do not want to see this item, add DropTotal=1.  Otherwise the default (DropTotal=0) will collect and display that information.

Graph Display Properties

GraphTitle=<name>
GraphCategory=<name>
GraphDraw=LINE
GraphArgs=--base 1000 --lower-limit 0
CounterFormat=double
CounterMultiply=1.000000
GraphTitle instructs rrdtool to add a title item to the graph.  GraphCategory instructs Munin how to group sets or graphs.  For a Windows Server performance analysis, appropriate GraphCategory groups include processor, memory, disk, system and network.  The graphs are then sorted alphabetically by GraphCategory then GraphTitle.

GraphDraw instructs rrdtool how to display and group items.  A counter that collects only one parameter may be displayed as a LINE (a single line on the graph) or an AREA (a line filled down to zero).  The illustration below depicts the difference between LINE and AREA.  You may also use LINESTACK or AREASTACK when mutliple items occur for each counter (as in Processor above).  These definitions sequentially stack items one on top of the previous.  The difference between the two is whether or not the area between is filled or not.

GraphArgs supplies rrdtool with additional instructions.  There are many available and the full list of rrd graph arguments is fully documented here.  If you want the x-axis intercept to always display as y=0, specify --lower-limit=0.  If counters are in percent and you always want the greatest y-axis value to be 100, specify --upper-limit=100.


CounterFormat defines the format of the numerical counter and may be either int (integer), double or large (int64).


CounterMultiply specifies a scaling factor.  For instance, system Uptime is reported in seconds; to change the value to days, multiply seconds by 1.1574074074074073e-005.

Example Munin Analysis of a Windows Memory Stress Test

This stress test utilizes HeavyLoad, a simple to configure application for processor, memory disk read and disk write tests. 


The two graphs above display information indicative of excessive memory load: Pages/sec and Total Page File % Usage.  Once physical memory (RAM) is full of data, Windows use the Page File (the equivalent of Linux swap space) to store additional data in demand by the processor.  Pages/sec measures the rate at which data is written to the page file; Total Page File % Usage measures how much of the page file space is used for storing data.
This excessive memory usage is also manifest in processor utilization, depicted in the graphs above.  At low utilization, the processor is in a high Idle state and also using a low-power state -- C1 -- to conserve energy.

The remaining counters will typically increase with load.  DPC is a lower-priority deferred processing queue.  User, privileged and priority time display the types of processes consuming CPU cycles; Processor time is analagous to total individual processor utilization.
The video below depicts a basic review of the stress test counters for this experiment.


List of Important Windows Server System Performance Counters

The following is the template for Windows Server 2008 R2 Performance Counters (munin-node.ini).

[Plugins]
; Plugin Section, 1 enables plugin, 0 disables
Disk=1
Memory=0
Processes=0
Network=0
MbmTemp=1
MbmVoltage=1
MbmFan=1
MbmMhz=1
SMART=0
HD=0
Cpu=0
SpeedFan=1
External=1

[DiskPlugin]
; Default Warning and Critical values for % space used
Warning=92
Critical=98

[ExternalPlugin]
; For External Plugins just add an entry with the path to the program to run
; It doesn't matter what the name of the name=value pair is
Plugin01=C:\Users\Jory\Documents\Visual Studio Projects\munin-node\src\plugins\python\disk_free.py

[PerfCounterPlugin_disktime]
DropTotal=1
Object=LogicalDisk
Counter=% Disk Time
CounterFormat=double
CounterMultiply=1.000000
GraphTitle=Disk Time
GraphCategory=disk
GraphArgs=--base 1000 -l 0
GraphDraw=LINE

[PerfCounterPlugin_uptime]
; This is a section for the Performance Counter plugin
; The Object and Counter settings are used to access the Performance Counter
; For uptime this would result in \System\System Up Time
; The Graph settings are reported to munin
; The DropTotal setting will drop the last instance from the list, which is often _Total
; Has no effect on single instance counters (Uptime)
; The CounterFormat setting controls what format the counter value is read in as a double, int, or large (int64).
; The plugin always outputs doubles, so this shouldn't have that much effect
; The CounterMultiply setting sets a value the counter value is multiplied by, use it to adjust the scale
; 1.1574074074074073e-005 is the result of(1 / 86400.0), the uptime counter reports seconds and we want to report days.
; So we want to divide the counter value by the number of seconds in a day, 86400.
Object=System
Counter=System Up Time
GraphTitle=Uptime
GraphCategory=system
GraphDraw=AREA
GraphArgs=--base 1000 -l 0
DropTotal=0
CounterFormat=large
CounterMultiply=1.1574074074074073e-005

[SpeedFanPlugin]
;\System\Threads
;------------------------------------------------------------------------------
BroadcastIP=192.168.0.255
UID=FF671100

[PerfCounterPlugin_Threads]
Object=System
Counter=Threads
GraphTitle=Number of Threads
GraphCategory=System
GraphDraw=LINE
GraphArgs=--base 1000 --lower-limit 0 --upper-limit 100
DropTotal=0
CounterFormat=int
CounterMultiply=1.000000

[PerfCounterPlugin_ErrorSystem]
Object=Server
Counter=Errors System
GraphTitle=Errors System
GraphCategory=System
GraphDraw=LINE
GraphArgs=--base 1000 --lower-limit 0 --upper-limit 100
DropTotal=0
CounterFormat=int
CounterMultiply=1.000000
CounterType=DERIVE

[PerfCounterPlugin_MemoryAvailableMBytes]
Object=Memory
Counter=Available Bytes
GraphTitle=Memory Available Bytes
GraphCategory=Memory
GraphDraw=AREA
GraphArgs=--base 1024 --lower-limit 0
DropTotal=0
CounterFormat=large
CounterMultiply=1.000000

[PerfCounterPlugin_PageingFileUsage]
Object=Paging File
Counter=% Usage
GraphTitle=Paging File(_Total) % Usage
GraphCategory=Memory
GraphDraw=AREA
GraphArgs=--base 1000 --lower-limit 0 --upper-limit 100
DropTotal=1
CounterFormat=int
CounterMultiply=1.000000

[PerfCounterPlugin_PageFaultsSec]
Object=Memory
Counter=Page Faults/sec
GraphTitle=Page Faults/sec
GraphCategory=Memory
GraphDraw=LINE
GraphArgs=--base 1000 --lower-limit 0 --upper-limit 100
DropTotal=0
CounterFormat=double
CounterMultiply=1.000000

[PerfCounterPlugin_PagesSec]
Object=Memory
Counter=Pages/sec
GraphTitle=Pages/sec
GraphCategory=Memory
GraphDraw=LINE
GraphArgs=--base 1000 --lower-limit 0
DropTotal=0
CounterFormat=double
CounterMultiply=1.000000

[PerfCounterPlugin_PageInputsSec]
Object=Memory
Counter=Page Input/sec
GraphTitle=Page Input/sec
GraphCategory=Memory
GraphDraw=LINE
GraphArgs=--base 1000 --lower-limit 0
DropTotal=0
CounterFormat=double
CounterMultiply=1.000000

[PerfCounterPlugin_CacheBytes]
Object=Memory
Counter=Cache Bytes
GraphTitle=Cache Bytes
GraphCategory=Memory
GraphDraw=LINE
GraphArgs=--base 1000 --lower-limit 0
DropTotal=0
CounterFormat=double
CounterMultiply=1.000000

[PerfCounterPlugin_PhysicalDiskSecRead]
Object=PhysicalDisk
Counter=Avg. Disk sec/Read
GraphTitle=PhysicalDisk(_Total) Avg. Disk sec/Read
GraphCategory=Disk
GraphDraw=LINE
GraphArgs=--base 1000 --lower-limit 0
DropTotal=1
CounterFormat=double
CounterMultiply=1.000000

[PerfCounterPlugin_PhysicalDiskSecWrite]
Object=PhysicalDisk
Counter=Avg. Disk sec/Write
GraphTitle=PhysicalDisk(_Total) Avg. Disk sec/Write
GraphCategory=Disk
GraphDraw=LINE
GraphArgs=--base 1000 --lower-limit 0
DropTotal=1
CounterFormat=double
CounterMultiply=1.000000

[PerfCounterPlugin_FileReadOpSec]
Object=System
Counter=File Read Operations/sec
GraphTitle=File Read Operations/sec
GraphCategory=Disk
GraphDraw=LINE
GraphArgs=--base 1000 --lower-limit 0
DropTotal=1
CounterFormat=double
CounterMultiply=1.000000

[PerfCounterPlugin_FileWriteOpSec]
Object=System
Counter=File Write Operations/sec
GraphTitle=File Write Operations/sec
GraphCategory=Disk
GraphDraw=LINE
GraphArgs=--base 1000 --lower-limit 0
DropTotal=1
CounterFormat=double
CounterMultiply=1.000000

[PerfCounterPlugin_DiskWriteBytes]
Object=PhysicalDisk
Counter=Avg. Disk Bytes/Write
GraphTitle=Avg. Disk Bytes/Write
GraphCategory=Disk
GraphDraw=LINE
GraphArgs=--base 1000 --lower-limit 0
DropTotal=1
CounterFormat=double
CounterMultiply=1.000000

[PerfCounterPlugin_DiskReadBytes]
Object=PhysicalDisk
Counter=Avg. Disk Bytes/Read
GraphTitle=Avg. Disk Bytes/Read
GraphCategory=Disk
GraphDraw=LINE
GraphArgs=--base 1000 --lower-limit 0
DropTotal=1
CounterFormat=double
CounterMultiply=1.000000

[PerfCounterPlugin_IOReadOpSec]
Object=Process
Counter=IO Read Operations/sec
GraphTitle=IO Read Operations/sec
GraphCategory=processes
GraphDraw=AREASTACK
GraphArgs=--base 1000 --lower-limit 0
DropTotal=1
CounterFormat=double
CounterMultiply=1.000000

[PerfCounterPlugin_IOWriteOpSec]
Object=Process
Counter=IO Write Operations/sec
GraphTitle=IO Write Operations/sec
GraphCategory=processes
GraphDraw=AREASTACK
GraphArgs=--base 1000 --lower-limit 0
DropTotal=1
CounterFormat=double
CounterMultiply=1.000000

[PerfCounterPlugin_IODataOpSec]
Object=Process
Counter=IO Data Operations/sec
GraphTitle=IO Data Operations/sec
GraphCategory=processes
GraphDraw=AREASTACK
GraphArgs=--base 1000 --lower-limit 0
DropTotal=1
CounterFormat=double
CounterMultiply=1.000000

[PerfCounterPlugin_IOOtherOpSec]
Object=Process
Counter=IO Other Operations/sec
GraphTitle=IO Other Operations/sec
GraphCategory=processes
GraphDraw=AREASTACK
GraphArgs=--base 1000 --lower-limit 0
DropTotal=1
CounterFormat=double
CounterMultiply=1.000000

[PerfCounterPlugin_Processor%IdleTime]
Object=Processor Information
Counter=% Idle Time
GraphTitle=% Idle Time
GraphCategory=processor
GraphDraw=LINE
GraphArgs=--base 1000 --lower-limit 0
CounterFormat=double
CounterMultiply=1.000000
DropTotal=1

[PerfCounterPlugin_Processor%InterruptTime]
Object=Processor Information
Counter=% Interrupt Time
GraphTitle=% Interrupt Time
GraphCategory=processor
GraphDraw=LINE
GraphArgs=--base 1000 --lower-limit 0
CounterFormat=double
CounterMultiply=1.000000
DropTotal=1

[PerfCounterPlugin_Processor%MaximumFrequencyTime]
Object=Processor Information
Counter=% Maximum Frequency Time
GraphTitle=% Maximum Frequency Time
GraphCategory=processor
GraphDraw=LINE
GraphArgs=--base 1000 --lower-limit 0
CounterFormat=double
CounterMultiply=1.000000
DropTotal=1

[PerfCounterPlugin_Processor%PriorityTime]
Object=Processor Information
Counter=% Priority Time
GraphTitle=% Priority Time
GraphCategory=processor
GraphDraw=LINE
GraphArgs=--base 1000 --lower-limit 0
CounterFormat=double
CounterMultiply=1.000000
DropTotal=1

[PerfCounterPlugin_Processor%PrivilegedTime]
Object=Processor Information
Counter=% Privileged Time
GraphTitle=% Privileged Time
GraphCategory=processor
GraphDraw=LINE
GraphArgs=--base 1000 --lower-limit 0
CounterFormat=double
CounterMultiply=1.000000
DropTotal=1

[PerfCounterPlugin_Processor%UserTime]
Object=Processor Information
Counter=% User Time
GraphTitle=% User Time
GraphCategory=processor
GraphDraw=LINE
GraphArgs=--base 1000 --lower-limit 0
CounterFormat=double
CounterMultiply=1.000000
DropTotal=1

[PerfCounterPlugin_Processor%C1Time]
Object=Processor Information
Counter=% C1 Time
GraphTitle=% C1 Time
GraphCategory=processor
GraphDraw=LINE
GraphArgs=--base 1000 --lower-limit 0
CounterFormat=double
CounterMultiply=1.000000
DropTotal=1

[PerfCounterPlugin_Processor%DPCTime]
Object=Processor Information
Counter=% DPC Time
GraphTitle=% DPC Time
GraphCategory=processor
GraphDraw=LINE
GraphArgs=--base 1000 --lower-limit 0
CounterFormat=double
CounterMultiply=1.000000
DropTotal=1

[PerfCounterPlugin_NetworkInterfaceOutputQueueLength]
Object=Network Interface
Counter=Output Queue Length
GraphTitle=Output Queue Length
GraphCategory=network
GraphDraw=LINE
GraphArgs=--base 1000 --lower-limit 0
CounterFormat=integer
CounterMultiply=1.000000
DropTotal=1

[PerfCounterPlugin_NetworkInterfaceOutboundDiscarded]
Object=Network Interface
Counter=Packets Outbound Discarded
GraphTitle=Packets Outbound Discarded
GraphCategory=network
GraphDraw=LINE
GraphArgs=--base 1000 --lower-limit 0
CounterFormat=double
CounterMultiply=1.000000
DropTotal=1

[PerfCounterPlugin_NetworkInterfaceOutboundErrors]
Object=Network Interface
Counter=Packets Outbound Errors
GraphTitle=Packets Outbound Errors
GraphCategory=network
GraphDraw=LINE
GraphArgs=--base 1000 --lower-limit 0
CounterFormat=double
CounterMultiply=1.000000
DropTotal=1
[PerfCounterPlugin_NetworkInterfaceReceivedDiscarded]
Object=Network Interface
Counter=Packets Received Discarded
GraphTitle=Packets Received Discarded
GraphCategory=network
GraphDraw=LINE
GraphArgs=--base 1000 --lower-limit 0
CounterFormat=double
CounterMultiply=1.000000
DropTotal=1

[PerfCounterPlugin_NetworkInterfaceReceivedErrors]
Object=Network Interface
Counter=Packets Received Errors
GraphTitle=Packets Received Errors
GraphCategory=network
GraphDraw=LINE
GraphArgs=--base 1000 --lower-limit 0
CounterFormat=double
CounterMultiply=1.000000
DropTotal=1

[PerfCounterPlugin_NetworkInterfaceBytesTotal/sec]
Object=Network Interface
Counter=Bytes Total/sec
GraphTitle=Bytes Total/sec
GraphCategory=network
GraphDraw=LINE
GraphArgs=--base 1000 --lower-limit 0
CounterFormat=double
CounterMultiply=1.000000
DropTotal=1

[PerfCounterPlugin_NetworkInterfaceBytesSent/sec]
Object=Network Interface
Counter=Bytes Sent/sec
GraphTitle=Bytes Sent/sec
GraphCategory=network
GraphDraw=LINE
GraphArgs=--base 1000 --lower-limit 0
CounterFormat=double
CounterMultiply=1.000000
DropTotal=1

[PerfCounterPlugin_NetworkInterfaceBytesReceived/sec]
Object=Network Interface
Counter=Bytes Received/sec
GraphTitle=Bytes Received/sec
GraphCategory=network
GraphDraw=LINE
GraphArgs=--base 1000 --lower-limit 0
CounterFormat=double
CounterMultiply=1.000000
DropTotal=1

Wednesday, June 11, 2014

Exchange Client Access Server Stress Test -- Zabbix Performance Counters

This simple example of and Exchange stress test uses Zabbix to collect performance counters to identify the bottlenecks on a Client Access Server.  Zabbix provides a fast and effective setup because, once installed, one simply uploads pre-formatted templates to record data and present it as screens and graphs.

The test environment consists of two Mailbox Servers, one Hub Transport Server and one Client Access Server which are stressed using Exchange 2010 Load Generator Outlook 2007 Online mode from a member server.  Each Exchange Server has a configured Zabbix Agent.


Exchange CAS Server Stress Test

Outlook 2007 Stress Test Topology

The Exchange Topology is illustrated below.  Each server is installed on an Oracle VirtualBox VM with two Intel i5 processors and 768 MB RAM.  While not an ideal environment -- due to shared SATA drive and limited RAM -- it suffices to display how Zabbix collects Windows Performance Counters and displays them in pre-configured graphs and screens designed for Windows Server and Exchange Hub Transport Server specific parameters.

This link provides the Exchange 2010 LoadGen Manual.  This link is the Exchange 2010 LoadGen Download.  Finally, this link documents Exchange 2010 Client Access Server Performance Counters.


Exchange Test Environment


The illustration below is an overview of processor loads on the four servers during an Outlook 2007 stress test.   EXCHANGE01 is the target Mailbox and EXCHANGE04 is the Client Access Server.  These both show heavy CPU loads while the Hub Transport and second Mailbox Servers show very low loads.
Processors on All Four Servers During an Outlook Stress Test

Detailed Stress Test Analysis

The video below illustrates the test and Zabbix data presentation.  As expected, the test environment is hardware-limited.  The data review at the end of the video illustrates:
  1. Disk performance is the limiting factor.  This is no surprise considering six VMs and a host share access to a single SATA drive.
  2. Processor load, while high, is not critically so.  However, if the test environment's disk subsystem were upgraded, two Intel i5 processors would soon be a bottleneck.
  3. The hardware limitations (and likely the Exchange 2010 LoadGen software) do not allow realistic tests of Outlook 2007 loads on the Exchange hardware-software system.
The reader is encouraged to review the video for a detailed data presentation.  The Zabbix Templates have not been fully validated and formatted.  However, the templates may be downloaded for testing.

Links to Exchange Server Zabbix Templates.


Sunday, June 8, 2014

Creating a Testing Environment with Oracle Virtualbox on Ubuntu 13.04 Desktop

Testing new systems is necessary before deployment, but maintaining the hardware to do so is often impractical.  Fortunately, virtual systems are available to build test environments.  This article describes building Oracle VirtualBox systems on Ubuntu 13.04 desktop.  Ultimately, there will be a four-office network connected by routers.  There will be web, e-mail and database services, a backup and a systems monitoring strategy.  However, the basics come first, and that requires a brief review of installing operating systems.

The Host laptop for this testing environment:
  •  Four-core, 2.6 GHz Intel i5 processor
  • 6 GB RAM
  • 500GB SATA Hard Disk with 6GB swap space
  • Ubuntu 13.04 Desktop
  • Lubuntu Desktop (an Ubuntu XFCE configuration)
  • Oracle VirtualBox 4.2.10_Ubuntu r84101
The host laptop shall also act as one of the offices (Coudersport).  The virtual machines will be configured to model three offices -- Philadelphia, Harrisburg and Pittsburgh -- connected by routers and redundant WAN links.  The following illustrates and describes creating a monitored Debian Wheezy SAN device.

First, start the VirtualBox management application from the desktop.


The host laptop will act as the central point through which all traffic is routed to the Internet.  From "File > Preferences", configure three Host Only network adapters:

  1. Interface vobxnet0: Address 10.0.0.1, Netmask 255.255.255.0 (connected to the eventual Philadelphia router)
  2. Interface vobxnet0: Address 10.100.0.1, Netmask 255.255.255.0 (acting as a router loopback address)
  3. Interface vobxnet0: Address 10.0.0.1, Netmask 255.255.255.0 (connected to the eventual Pittsburgh router)


The virtual media -- hard disks -- may also be managed through "File > Virtual Media Manager."


The Settings icon opens a dialog that provides detailed configuration of the virtual hardware.  A previously configured monitoring server -- requiring web, database and e-mail servers -- is depicted below.

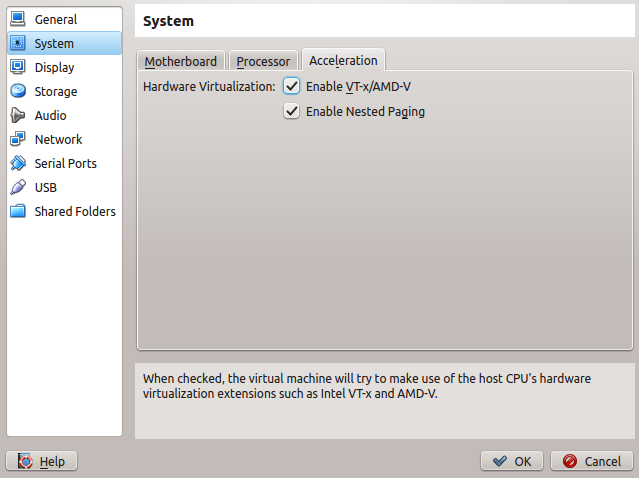
The motherboard resources are available from the System icon.  The monitoring server consists of 512 MB main memory, two processors and hardware acceleration.


The disk subsystem consists of a Serial ATA controller for the DVD drive and a serial SCSI controller for the hard disk.


Switching to a previously configured router, the network interfaces consist of a Host-only adapter and three Internal Network adapters.  The Host-only adapter option connects to virtual  network adapters configured above on the host laptop.  Internal Network adapters run on a virtual switched environment, each switch identified by a unique name.  Each virtual switched network acts as a single broadcast domain, isolating the virtual machines from not only hosts on other virtual switches, but also from the host operating system.  Thus, routers are needed to connect virtual switches to one another.  This router is configured to connect to one Host-only Network (the host laptop's operating system through network vboxnet2) and three virtual Internal Networks:


  1. PHL-PIT - the WAN link between Philadelphia and Pittsburgh
  2. PIT-HBG - the WAN link between Harrisburg and Pittsburgh
  3. PIT - the Pittsburgh Office private network

Oracle provides a detailed description of the networking options.


The above information defines the networking required to build a SAN server on the Pittsburgh private network (VirtualBox adapter 4, OS adapter eth3, 10.202.0.0/24).  The following illustrations depict setting up the hardware for the server.

First, name the machine and specify the operating system -- in this case 64-bit Debian Linux.


Specify the installed main memory.

Define a virtual hard disk.  By default, VirtualBox will assign a dynamically-sized disk that grows as needed up to the specified size.  However, there is a small performance penalty compared to a fixed virtual disk in which all disk space is allocated upon creation.  Since there will be many hosts operating simultaneously, select a Fixed Size virtual disk.


The machine is ready to boot after the hard disk is created, however it is not configured for the test network and selected operating system.  VirtualBox creates an IDE controller for the DVD device and a Serial ATA device for the hard disk.  Debian Linux suffers a significant performance penalty for ATA and SATA hard disks on VirtualBox -- despite the host laptops SATA architecture.  Remove the Virtual Controllers (NOT the disks), add a SATA controller for the DVD and a SAS controller for the hard disk.  VirtualBox will prompt you to create a new hard disk or select an existing one; use the existing hard disk that is in the directory VirtualBox created for the new server.


By default, VirtualBox creates one network adapter that attaches to the host network adapter by Network Address Translation.  Thus, we need to change the network adapters for the SAN Server to four devices (Intel Pro 1000/MT Desktop Adapters) connected to the PIT switch for the Pittsburgh private network.


Once the network adapters are configured, go to Storage and add the bootable Debian Wheezy DVD .iso as the DVD on the SATA controller.

Power on the virtual machine and install just as you would on hardware.


Once the machine is installed, there are some minor adjustments to prepare it for deployment to the test environment.  Debian configures only one network adapter during installation, so edit the /etc/network/interfaces file to add the additional adapters and then restart networking with the two commands "service networking stop" and "service networking start" ("service networking restart" is unreliable under Debian Wheezy; use the two commands to assure networking restarts correctly).


Modify the /etc/apt/sources.list file to add the "wheezy", "wheezy-updates" and "wheezy-backports" "main" and "contrib" mirrors of your choice.  We will install webmin -- the web-based system configuration package.  Add the webmin and somersettechsolutions sites as well, and then fetch the key from webmin and add it to the the apt keys.


Next, update the repository list with "apt-get update."  this will add the sources we need to install applications required for the test environment.


The applications we need can be downloaded and installed using apt-get install.  snmp and snmpd are the Simple Network Monitoring Protocol packages.  The SAN will provide network storage services with iscsitarget.  Webmin is a management package.  Nagios, Xymon, Munin and Zabbix are network and host monitoring applications that will be discussed in a later article.


Notice while installing there are 20 packages listed that may be upgraded (patched).  Updates will be applied later.

While installing, Xymon will prompt for the address of a monitoring server.  If this is installed already -- or if its address has been previously planned -- enter it.  The configuration file may be changed later, so it is not critical to assign it at this time.

Upon completion, the system is ready to configure.  Below are a sample Webmin Main and iSCSI Target configuration screens.  These,too, will be discussed in a later article.


Upon installing all required packages, install all available updates with the command "apt-get dist-upgrade."  Reboot if kernel updates are installed.

The host is installed and ready to deploy for final configuration.  The tasks to build the network are the subjects of future articles.

Exchange 2010 Architecture

<data:blog.title/> <data:blog.pageName/> The Exchange 2010 enterprise messaging and collaboration platform is built on a modular architecture consisting of Edge Transport, Hub Transport Client Access, Mailbox and Unified Messaging Servers.  The Architecture provides scalabilty and fault-tolerance for the messaging system, much of which may be implemented without clustering.


Multi Site Exchange Data and Logical Structure


A more detailed poster is available from Microsoft here.

List of Exchange Component Servers

Edge Transport Server

The Edge Transport Server is a dedicated SMTP mail delivery server designed for the DMZ.  This is were antivirus and antispam filtering takes place.  An additional benefit is that this role separates SMTP traffic from other types of external traffic (e.g. web-based access) for better scalability.


The Edge Transport Role is nothing more than an SMTP gateway.  Other third-party mail gateways may fulfill this role.  One example detailed in another article is using an Active Directory Integrated Postfix Mail Gateway to Exchange.

Hub Transport Server

The Hub Transport Server role is dedicated to internal message routing and policy.  For instance, the a hub server will retain a copy of a message until it receives an acknowledgement that is has been successfully delivered to a mailbox.  It also maintains communications with Mailbox Servers (see below) concerning availability and dumpster maintenance; it will not purge older messages in the dumpster until all logs have been successfully replicated.

Client Access Server

The Client Access Server Role provides local and remote client access using a variety of protocols such as local Outlook MAPI client access over Remote Procedure Calls (RPC), web client access over HTTPS, ActiveSync access over HTTPS and remote Outlook client access using RPC over HTTPS.


The Client Access Server role, operating separately, has scalability in mind.  Under heavy client loads, they can be clustered using a hardware load balancer or other network load balancing technology such as HAProxy.


The Client Access Server role uses so many protocols in addition to those listed above (Kerberos, for example) that there may not be a firewall between the Client Access Server and the rest of the Exchange infrastructure.  Microsoft states that direct access to the private network -- bypassing the DMZ -- is required for external clients connecting to a Client Access Server.  So, one must open HTTPS from the External (Internet) firewall zone directly to the Private zone.  Microsoft also states that the Client Access Server is "hardened" for security and that this arrangement poses no problem.

Indeed, the author has tested the implementation and it has reasonable measures (such as denying all ICMP packets via Windows Firewall) to resist script kiddies.  A reverse proxy such as Nginx or Apache in the DMZ does not afford much web application protection from a more realistic application penetration as described in an article Suricata IDS -- Arachni Vulnerability Scan.  The author stands firmly on the fence with regards to whether to allow direct access from the Internet or installing a reverse proxy in the DMZ.  An article describing an Apache Reverse Proxy to Exchange Client Access Server describes how this is implemented.

Mailbox Server

The Mailbox Server role provides message storage.  Essentially, it is a database server integrated with Windows Active Directory and the rest of the Exchange messaging and collaboration system.  As such, it is as hardware intensive as any other database server.

Unified Messaging Server

The Unified Messaging role is a gateway from a PBX or VOIP voice system into Exchange.

Recommended Exchange Server Role Ratios

Live Exchange Systems are complex.  A small business can deploy all roles on a single server.  Medium businesses will have to deploy two or more servers depending upon the size of the company and overall load.  Enterprises require very complex implementations with one or many servers (and potentially load balancers) incorporated into the design.  Microsoft provides the follow general rules for ratios of cores and memory for large Exchange deployments:

Client Access Server (CAS)

CAS to Mailbox ratio = 3 : 4 processor cores
8 cores recommended, 2GB RAM per core

Hub Transport server

Hub to Mailbox ratio : 1 : 7 (no A/V on Hub) or 1 : 5 (with A/V Hub) processor cores
4 cores recommended, 1GB RAM per core

Mailbox Server

4-8 cores, 4GB RAM base + 2-8MB per mailbox based on mail profile

Unified Messaging Server

4 cores, 4-8GB RAM total

Edge Transport Server

2 to 4 cores

Global catalog to Mailbox ratio 1 : 8 (64-bit GC) processor cores


Sunday, June 1, 2014

Zabbix Windows Server, Domain Controller,DNS and IIS Performance Monitoring

This article describes Windows Server 2008 R2 Zabbix Templates that monitor core server functions, Domain Controllers, DNS Servers and IIS 7.5.  While built specifically for those systems, it us likely  the Templates are compatible with other versions of Windows as well.

For those with Zabbix and Windows experience, the counters used are available from the Zabbix Share page:

Windows Server ships with a excellent monitoring and trend analysis tool: Performance Monitor.  As illustrated below, it allows administrators to select and graph counters that include list of system metrics.  These measurements may also be saved as delimited text files for future analysis and visualization.  A centralized server may connect to other servers to remotely collect data.  Since the API is well-documented, it is integrated into other value-added systems monitoring software.


Windows Server Performance Monitor


Selecting Windows Server Performance Monitor Counters

The illustration below depicts the text format of a Windows Performance Monitor counter.  Commands conforming to this syntax may be sent from remote monitoring servers whose applications comply with the Windows API.
Displaying Windows Server Performance Monitor Syntax

Prerequisites

A thorough knowledge of Zabbix installation and configuration is necessary.  This article, Installing and Configuring Basic Zabbix Functionality on Debian Wheezy, describes the basics. Several additional articles of advanced topics are available here.  This article, Zabbix Templates for Windows 2008 R2 OS and Domain Controllers, provides a detailed description of Template design.  Finally, Automated Zabbix Deployment and Configuration for Windows Enterprises describes how to deploy and configure Windows Agents and touches upon Discovery.

Description of Monitored Windows 2008 R2 Services and Counters

Zabbix uses service state checks to monitor Windows Services; it uses performance counter checks to monitor Processor, Memory, Disk and Network counters.  The services and counters listed below are common to Windows Server 2008 R2 regardless of applications installed.  They are indicative of overall performance (or problems) but do not necessarily pinpoint the root issue(s); more advanced -- and specific -- checks are required to diagnose application issues.

Links to Windows 2008 R2 Server Zabbix Templates.

Windows Server Services

Distributed Transaction Coordinator (MSDTC)
Group Policy Client (gpsvc)
Netlogon (Netlogon)
Network List Service (netprofm)
Network Location Awareness Service (nlasvc)
Network Store Interface (nsi)
RPC Endpoint Mapper (RpcEptMapper)
Security Accounts manager (SamSs)
Server Service (LanmanServer)
Event Log Service (eventlog)
Windows Firewall Service (MpsSvc)
Windows Time Service (W32Time)
Workstation Service (LanmanWorkstation)
DNS Client (Dnscache)

TCP Ports

135 MSRPC
139 NetBIOS-ssn
445 NetBIOS-ssn

Processor

Current work queue
Processor Percent Idle Time
Processor Percent Processor Time
System Processor Queue Length

Memory

Memory Available MBytes
Memory Free System Page Table Entries
Memory Pages Input/sec
Memory Pages/sec
Memory Pool Nonpaged Bytes
Memory Pool Paged Bytes

Memory Cache Bytes 
Memory Percent Registry Quota in Use
Memory Percent Committed Bytes in Use

Disk

LogicalDisk Avg. Disk sec/Read
LogicalDisk Avg. Disk sec/Write
LogicalDisk Disk Transfers/sec
 

Network

Network Interface Output Queue Length
Network Interface Bytes Total/sec
 
Network Interface Bytes Sent/sec

Windows Domain Controller Monitoring and Trend Analysis

The format and use of the command and service definitions are the same as those described above.

Links to Windows Domain Controller Zabbix Templates and Windows Domain Controller Performance Monitoring Templates:

Microsoft provides a summary of Windows Domain Controller Performance Counters.

Summary of Monitored Services and Counters

Windows Domain Controller Services

Active Directory Domain Service (NTDS)
Active Directory Web Services(ADWS)
Intersite Messaging Service (IsmServ) 
Kerberos Key Distribution Center (kdc)

TCP Ports

389 LDAP
464 Kerberos Password
636 LDAPS
3268 Global Catalog
3269 Global Catalog

Windows Server Domain Controller (NTDS) Counters

NTDS DRA Inbound Full Sync Objects Remaining
NTDS DS Notify Queue Size
NTDS LDAP Bind Time
NTDS SAM Account Group Evaluation Latency

Summary of DNS Server Services and Counters

Links to Windows DNS Server Zabbix Templates  and DNS Server Performance Monitoring Zabbix Templates:
 Microsoft provides a summary of Windows DNS Server Performance Counters.

Windows DNS Server Services

DNS Server (DNS)

TCP Ports

53 DNS

Windows DNS Server Counters

Caching Memory
Database Node Memory
Record Flow Memory
Recursive Query Errors
Secure Update Failure
TCP Message Memory
Total Query Received
Total Query Received/sec

UDP Message Memory 
Zone Transfer Failure
Zone Transfer Success

Summary of IIS Server Services and Counters

IIS has changed repeatedly over time and Microsoft-recommended performance counters are generally out-of-date.  The list was developed from a variety of sources and intended to reflect the basic IIS 7.5 Server functions.  Other counters (such as ASP.NET, etc.) are more appropriate to various application environments, such as the Windows Application Server Role, which adds the .NET environment.

Links to Windows IIS Server Zabbix Template:

Windows IIS Server Services

IIS Admin (IISAdmin
World Wide Web Publishing (W3SVC)

TCP Ports

80 HTTP
443 HTTPS

Windows IIS Server Counters

Bytes Received/sec
Bytes Sent/sec
Bytes Total/sec
Current Connections
GET Requests/sec
POST Requests/sec
Current Files Cached
Current Metadata Cached
Current URIs Cached
File Cache Hits %
Metadata Cache Hits
URI Cache Hits %

Server 2008 R2, Domain Controller and DNS Server Performance Monitoring Templates

Performance Monitoring Counters are included for advanced troubleshooting, trending and capacity planning.  These counters unlikely useful for day-to-day monitoring and should be used only when needed in those scenarios.

Discovery

 As briefly described in the article Automated Zabbix Deployment and Configuration for Windows Enterprise, Active Directory GPOs deploy a customized zabbix_agentd.conf file.  The file specifies UserParameters that issue shell commands used to determine if windows Services are present; if the command returns "already been started," Actions configured on the Zabbix server add the host to specified Host Groups and link pertinent templates.  For instance, if the shell command "net start NTDS" returns (as prt of its response) "already been started," the Zabbix server adds the host to the Windows Domain Controllers Host Groups and links Template Windows Domain Controllers.
Zabbix Windows Domain Controller Discovery Rule

Zabbix Windows Domain Controller Action Conditions

Zabbix Windows Domain Controller Action Operations
The configuration file definitions that support Discovery and Actions are:
  1. UserParameter=services.NTDS,net start NTDS
  2. UserParameter=services.DNS,net start DNS
  3. UserParameter=services.W3SVC,net start W3SVC 
There is no need to add a UserParameter statement for discovering the Windows OS because the Zabbix Agent natively supports the command system.uname for returning the required OS information.

Example Screen


The illustration below depicts a screen consisting of four Memory Counter graphs. The
screen depicts the interaction of Memory and Disk performance at boot time, in which low available memory leads to paging.  The root cause of the problem is the lack of memory, however it is also manifest as high disk IO.

Displaying Windows Server Performance Monitor Counters in Zabbix Graphs and Screens


Installing the Zabbix Windows 2008 R2 and Domain Controller Templates

The following video depicts installing the templates (which also creates the necessary Host Groups), creating hosts, adding them to the Host Groups and applying the Templates.


Zabbix CPU Stress Test Monitoring

The following video depicts running a CPU Stress Test on one server.


Zabbix CPU and Memory Stress Test Monitoring