Search This Blog

Wednesday, April 23, 2014

Linux - Microsoft Exchange Integration -- Apache Reverse Proxy to Exchange Client Access Server

Exchange 2010 Web Access Architecture

A detailed diagram of the Exchange 2010 architecture is available here.  However, for this article a working knowledge of Microsoft IIS and Apache are assumed.  Exchange uses one or more Client Access Servers (CAS) to allow client Access to information maintained in Mailbox Stores.  The CAS is integrated with Active Directory, IIS and Exchange MAPI (among other protocols) to authenticate and present information to a variety of clients such as Outlook, POP3 / IMAP4 programs and mobile devices.  Access to scheduling information is provided through ActiveSync.

In older versions of Exchange, the Outlook Web Access (OWA) server was simply an IIS server that could be placed in the DMZ for security.  Exchange 2010 CAS servers, being closely integrated with Active Directory, require almost unrestricted access to Domain Controllers and Exchange Message Stores and attempts to restrict access through firewall filtering are likely to break the communications required for a CAS server to operate correctly.  Microsoft suggests using Network Address Translation to direct HTTP/HTTPS traffic to the CAS server that is in the private network, although Microsoft also states that reverse proxy servers may be placed in the DMZ.

Microsoft states that the CAS server (running on Windows Server with the Exchange CAS Role) has been sufficiently hardened that opening it directly to HTTP/HTTPS access is safe.  Perhaps this is true, but Microsoft also has a long history of security issues associated with IIS. Coupled with the requirement that the server is joined to an Active Directory Domain, there are concerns despite Microsoft's assurances to the contrary.

There are several options available, such as a proprietary firewall reverse proxy, IIS reverse proxy (optionally in a load-balanced server farm) and Apache (optionally in a load-balanced server farm).  The Microsoft IIS option does not require joining the web servers to the domain, which enhances security.  However, Apache is an entirely different architecture, which provides even greater security benefits.

The Test Environment


As depicted above, the external interface(s) of the firewall will permit HTTP/HTTPS traffic and Network Address Translate (NAT) it to an interface on a Linux server running Apache Proxy.  Apache is configured to rewrite the requests to the CAS server https://exchange02.mydomain.com directories /owa, /ecp and /Microsoft-Server-ActiveSync.  The CAS server then sues Active Directory to authenticate and access Mail Store and Hub Transport servers.

The Apache Configuration

The following lines configure Apache to reverse proxy requests from the firewall server (cou-firewall.mydomain.com) to the Exchange CAS server (exchange02.mydomain.com).  Under Debian Wheezy, these are placed in the /etc/apache2/sites-available/default file.

<VirtualHost *:80>
ServerName cou-firewall.mydomain.com
ServerAlias exchangemail.mydomain.com
ServerAlias mail.mydomain.com
ServerAdmin webmaster@mydomain.com
ErrorLog /var/log/apache2/error.log
CustomLog /var/log/apache2/access.log combined
Header always set X-Frame-Options SAMEORIGIN
Header set Server Apache
Header unset X-AspNet-Version
Header unset X-OWA-Version
Header unset X-Powered-By
ProxyRequests Off
RewriteEngine On
RewriteCond %{HTTPS} !=on
RewriteRule ^/owa(.*) https://exchange02.mydomain.com/owa$1 [R,L]
RewriteRule ^/ecp(.*) https://exchange02.mydomain.com/ecp$1 [R,L]
RewriteRule ^/Microsoft-Server-ActiveSync(.*) https://exchange02.mydomain.com/Microsoft-Server-ActiveSync
DocumentRoot /var/www
<Directory />
Order deny,allow
Deny from all
</Directory>
<Directory /var/www>
DirectoryIndex index.php index.html
Options -Indexes +FollowSymLinks
Order allow,deny
Allow from all
</Directory>
<Proxy *>
Order deny,allow
Allow from all
</Proxy>
</VirtualHost>
### SSL Host ###
<IfModule mod_ssl.c>
<VirtualHost *:443>
ServerName exchangemail.mydomain.com
ServerAdmin webmaster@mydomain.com
ErrorLog /var/log/apache2/error.log
CustomLog /var/log/apache2/access.log combined
Header always set X-Frame-Options SAMEORIGIN
Header set Server Apache
Header unset X-AspNet-Version
Header unset X-OWA-Version
Header unset X-Powered-By
ProxyRequests Off
ProxyPreserveHost On
SSLProxyEngine On
# owa
ProxyPass /owa https://exchange02.mydomain.com/owa
ProxyPassReverse /owa https://exchange02.mydomain.com/owa
# ecp
ProxyPass /ecp https://exchange02.mydomain.com/ecp
ProxyPassReverse /ecp https://exchange02.mydomain.com/ecp
# Microsoft-Server-ActiveSync
ProxyPass /Microsoft-Server-ActiveSync https://exchange02.mydomain.com/Microsoft-Server-ActiveSync
ProxyPassReverse /Microsoft-Server-ActiveSync https://exchange02.mydomain.com/Microsoft-Server-ActiveSync
DocumentRoot /var/www
<Directory />
Order deny,allow
Deny from all
</Directory>
<Directory /var/www>
DirectoryIndex index.php index.html
Options -Indexes +FollowSymLinks
Order allow,deny
Allow from all
</Directory>
<Proxy *>
SetEnv proxy-nokeepalive 1
SetEnv force-proxy-request-1.0 1
Order deny,allow
Allow from all
</Proxy>
SSLEngine on
SSLCertificateFile /etc/ssl/certs/ssl-cert-snakeoil.pem
SSLCertificateKeyFile /etc/ssl/private/ssl-cert-snakeoil.key
</VirtualHost>
</IfModule>
 

Note that the SSLCertificateFile and SSLCertificateKeyFile use the sss-cert-snakeoil files that are installed by default.  These may be replaced with valid SSL files and referenced as such. 
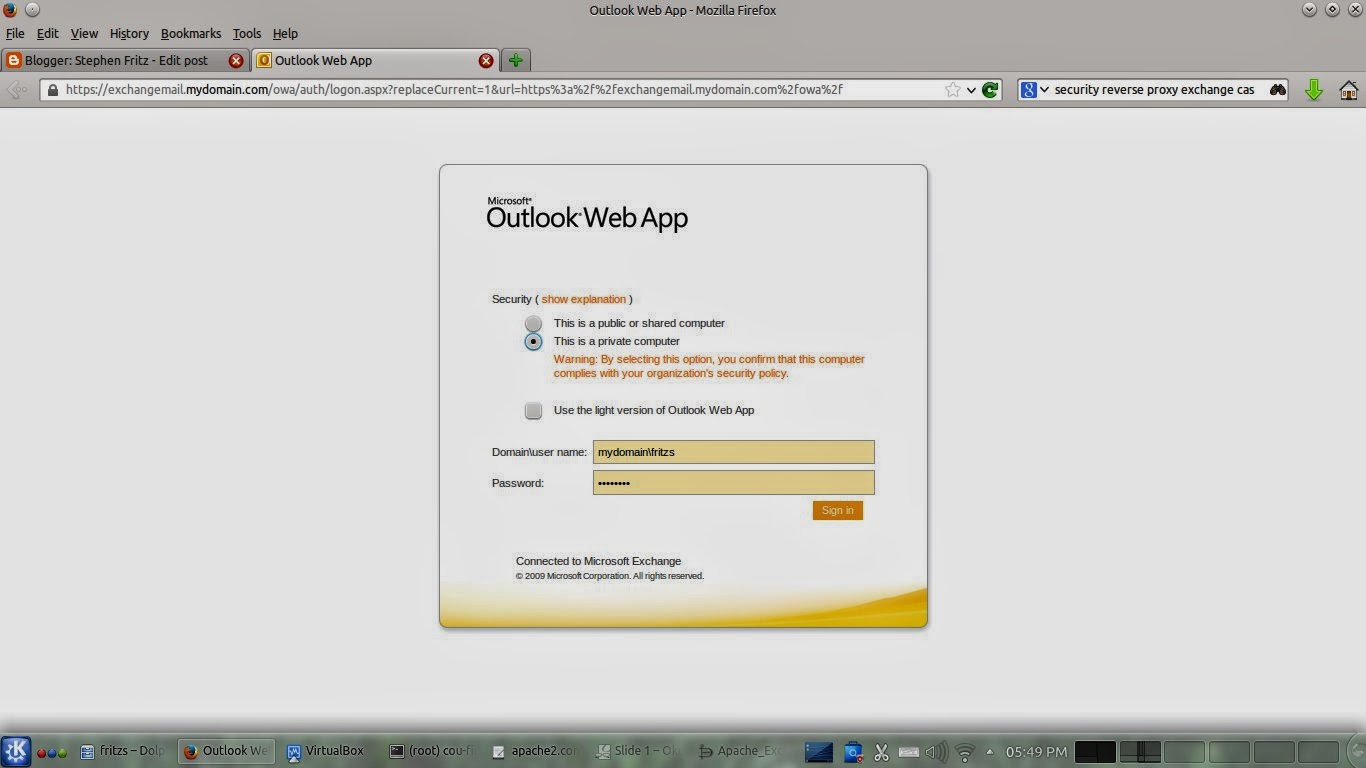
Reverse Proxy OWA
The SSL Certificate used for this example will not be verified, so the browser will present a warning when the web site is first accessed.  This may safely be accepted.

The browser then presents a familiar prompt to log on by providing "domain\username" and "password,"
After which, access to OWA is granted.

Linux - Microsoft Active Directory Integration -- Postfix Mail Gateway to Exchange

Exchange 2010 Mail Delivery Architecture

A detailed diagram of the Exchange 2010 architecture is available here.  However, for this article a working knowledge of SMTP, Exchange message routing and Active Directory are assumed.  SMTP messages from the Internet are delivered to an SMTP connector on a Hub Transport Server; optionally, an Internet-facing filtering Edge Transport Server may be placed in the DMZ. The Hub Transport system delivers messages to one or more Mailbox Stores; clients access the message stores through one or more Client Access Servers.

The built-in filtering capabilities of the Exchange Edge Transport Server are crude, inefficient and prone to false positives.  For instance, one method is manually entering suspicious words and phrases -- a technique highly prone to false positives.  Connection Filtering allows the administrator to specify allowed and blocked IP addresses or subscribe to a allow/block service provider; these, too, are unreliable and prone to false positives because netblocks may be misidentifed or, worse, the provider may not be responsive to removing netblocks that have been corrected.

Postfix - Exchange Replacement of Exchange Edge Transport

Postfix is easily configured to act as a mail relay -- a role that replaces Exchange Edge Transport, integrates into Active Directory and provides reliable spam and virus filtering.  The following packages provide this functionality:
  1. postfix
  2. postfix-ldap
  3. the Net::LDAP perl module
  4. postgrey
  5. clamsmtp
  6. clamav-freshclam
Postfix acts as the SMTP server and MTA.  Postfix-ldap and Net::LDAP perform Domain Controller queries that route messages from the postfix server to Exchange SMTP hub Transport Servers.  Postgrey is a greylisting daemon that filters inbound SMTP messages that originate from non-compliant SMTP servers used by the overwhelming majority of spammers.  The Clam packages provide virus filtering.

Install Software

Issue the following command to install the software packages:

#apt-get install postfix postfix-ldap postgrey clamsmtp clamav-freshclam


Then add Net::LDAP from CPAN.  Finally, update the virus definitions with the command:

# freshclam

Enable the Postgrey Greylisting Daemon

Adding greylisting only requires modifying the /etc/postfix/main.cf file by adding the following line:

smtpd_recipient_restrictions = check_policy_service inet:127.0.0.1:10023


Greylisting identifies the predominant type of illicit -- and non-compliant -- SMTP servers used by spammers.  These servers only forward e-mail -- they do not store e-mail and retry if the first attempt fails.  Thus, if the Postfix mail server refuses initial delivery, the spam mail server does not try again and the messages is not delivered.

Postgrey is efficient once operational.  When it receives a message, it reads the sender:, recipient: and sending mail server IP address "triplet".  It compares the triplet to entries in a Berkley database and if the triplet is found, the message is delivered without delay.  If it is not found, postgrey writes the triplet to the database and will not accept the message for a specified delay interval (typically one to five minutes).  That is, the first time a legitimate mail server sends a message from one party to another, there is a delay before acceptance and delivery, but after that the message is delivered without delay.  Spam mail servers, lacking the store capability, do not try a second time.

In practice, the author has found this blocks 97% to 98% of spam without any false positives.

Enable the ClamSMTP Virus Scanning Daemon

The Clam Antivirus suite is an open source project that provides host and mail virus filtering.  It utilizes the clamav-freshclam daemon to regularly update virus definition databases.  The clamsmtpd daemon is called from postfix.  There are several modifications to the postfix configuration files to implement mail virus filtering.

First, add the following lines to /etc/postfix/main.cf:

content_filter = scan:127.0.0.1:10025
receive_override_options = no_address_mappings
 

Then, add the following lines to /etc/postfix/master.cf:
scan unix - - n - 16 smtp
-o smtp_send_xforward_command=yes
# For injecting mail back into postfix from the filter
127.0.0.1:10026 inet n - n - 16 smtpd -o content_filter=
-o receive_override_options=no_unknown_recipient_checks,no_header_body_checks
-o smtpd_helo_restrictions=
-o smtpd_client_restrictions=
-o smtpd_sender_restrictions=
-o smtpd_recipient_restrictions=permit_mynetworks,reject
-o mynetworks_style=host
-o smtpd_authorized_xforward_hosts=127.0.0.0/8
 

Postfix requires another modification to the clamsmtpd daemon listener ports.  Edit the /etc/clamsmtpd.conf file and change:

OutAddress: 10025 to OutAddress: 10026
Listen: 127.0.0.1:10026 to Listen: 127.0.0.1:10025


The postfix daemon will now incorporate virus filtering through its MTA.  You may test it using the eicar.zip virus-testing standard file.

Enable Postfix LDAP Lookups to Active Directory

Finally, postfix must forward mail to the Exchange Hub Transport system.  Many articles on this subject recommend automated extraction of valid SMTP addresses from Active directory, copying them to the postfix server and hashing them as alias maps.  This is, indeed, more secure and prevents high-volume directory queries during dictionary attacks.  However, many of these articles also state that such directory lookups can DOS an Exchange System.  This is not true unless the queries are performed on an Exchange Server that is also a Domain Controller, a practice not recommended.  You may perform LDAP queries to multiple Domain Controllers (including clustered Samba - Linux Domain Controllers), so the risk is not as great (although not necessarily negligible) as many articles state.

For this case, configure postfix to use LDAP to query one or more local Domain Controllers.  Make sure there are internal DNS MX records in Active Directory.  Add a non-privileged user named mailuser to the Active Directory Users container.  Then add the following line to /etc/postfix/main.cf:

alias_maps = ldap:/etc/postfix/ldap-aliases.cf
 

Finally, create an ldap-aliases.cf file with the following contents:
 

server_host = [one or more Domain Controller IP Addresses or FQDNs]
search_base = dc=mydomain,dc=com
bind = yes
bind_dn = cn=mailuser,cn=Users,cn=mydomain,cn=com
bind_pw = s3cr3tp455w0rd


Additional Features

Although not discussed in this article, several additional features may be used to secure the Postfix - Exchange mail relay.  Postfix is easily configured for load-balancing clustering with Pacemaker - Corosync - LCMC.  Additional Domain Controllers may be added (and load-balance clustered) using Samba.

Postscreen is another Postfix feature that applies policy checks to incoming mail servers.  A detailed HOW-TO is available here.


Monday, April 14, 2014

Nagios / Icinga Performance Data Graphing with PNP4Nagios


This article describes how to modify Nagios/Icinga configuration files, create templates, use the Nagios Perfdata C Daemon (NPCD) and modify Apache files to run PNP4nagios, a data presentation package that uses the RRDTool graphing package. 
PNP4Nagios Recording a Windows CPU Stress Test

PNP4Nagios packages

Begin by installing the required packages:
    # aptitude install pnp4nagios icinga­-web-­pnp

Modify the /etc/icinga/icinga.cfg file

RRDtool uses performance data generated by pnp4nagios to build graphs. The lines required are in the icinga.cfg file, but commented out. You may either edit the existing commented lines or append the following to the end:
# performance data
process_performance_data=1

service_perfdata_file_template=DATATYPE::SERVICEPERFDATA\tTIMET::$TIMET$\tHOSTNAME::$HOSTNAME$\tSERVICEDESC::$SERVICEDESC$\tSERVICEPERFDATA::$SERVICEPERFDATA$\tSERVICECHECKCOMMAND::$SERVICECHECKCOMMAND$\tHOSTSTATE::$HOSTSTATE$\tHOSTSTATETYPE::$HOSTSTATETYPE$\tSERVICESTATE::$SERVICESTATE$\tSERVICESTATETYPE::$SERVICESTATETYPE$

host_perfdata_file_template=DATATYPE::HOSTPERFDATA\tTIMET::$TIMET$\tHOSTNAME::$HOSTNAME$\tHOSTPERFDATA::$HOSTPERFDATA$\tHOSTCHECKCOMMAND::$HOSTCHECKCOMMAND$\tHOSTSTATE::$HOSTSTATE$\tHOSTSTATETYPE::$HOSTSTATETYPE$

service_perfdata_file_mode=a
host_perfdata_file_mode=a

service_perfdata_file_processing_interval=30
host_perfdata_file_processing_interval=30

service_perfdata_file=/var/spool/pnp4nagios/nagios/service-perfdata
host_perfdata_file=/var/spool/pnp4nagios/nagios/host-perfdata

service_perfdata_file_processing_command=pnp-bulknpcd-service
host_perfdata_file_processing_command=pnp-bulknpcd-host

Add PNP4Nagios Commands and Host and Service Templates

If you are using the standard installation and preparing configuration files yourself, the commands will be located in /etc/icinga/commands.cfg. However, if you preparing your own configuration files (either manually or using tools such as NConf), add the following commands:
    # pnp4nagios
    define command{
            command_name    pnp-bulknpcd-service
            command_line    /bin/mv /var/spool/pnp4nagios/nagios/service-perfdata /var/spool/pnp4nagios/npcd/service-perfdata.$TIMET$
    }
    
    define command{
            command_name    pnp-bulknpcd-host
            command_line    /bin/mv /var/spool/pnp4nagios/nagios/host-perfdata /var/spool/pnp4nagios/npcd/host-perfdata.$TIMET$
    }
    
    The following Host Template defines and action URL that will be used for any hosts to which the template is applied:
      define host {
              name       pnp-hst
              register   0
              action_url /pnp4nagios/graph?host=$HOSTNAME$' class='tips' rel='/pnp4nagios/popup?host=$HOSTNAME$&srv=_HOST_
      }
      
      
        The following Service Template defines and action URL that will be used for any services to which the template is applied:
          define service {
                  name       pnp-svc
                  register   0
                  action_url /pnp4nagios/graph?host=$HOSTNAME$&srv=$SERVICEDESC$' class='tips' rel='/pnp4nagios/popup?host=$HOSTNAME$&srv=$SERVICEDESC$
          }
            Then add the templates with the "use" statement in the host and service definitions for which you want graphs:
            define host{
                    name                            generic-host
                    use                             pnp-hst
            
            define service{
                    name                            generic-service
                    use                             pnp-svc
            

            Enable the Nagios-Perfdata-C-Daemon

            The Nagios-Perfadata-C-Daemon provides bulk mode processing. If you process performance data using only commands in the nagios.cfg or icinga.cfg file -- Synchronous Mode Processing -- there is a heavy load on the server. Each time a service check executed, it calls process_perfdata.pl. Bulk mode processing temporarily saves performance data to a file and uses NPCD to process it all at once.

            Enabling NPCD requires only modifying the /etc/default/npcd file and setting "Run=yes."

            Copy Web Server Files

            Copy the Web Server Files and Clear the Icinga-Web Cache
            Finally, integrate PNP4Nagios with the web applications by copying two files

            # cp /usr/share/doc/pnp4nagios/examples/ssi/status-header.ssi /usr/share/icinga/htdocs/ssi/status-header.ssi
            # chmod 644 /usr/share/icinga/htdocs/ssi/status-header.ssi
            Any time you change configurations in Icinga-Web, clear the configuration cache with:
            /usr/local/icinga­web/bin/clearcache.sh
            The video below demonstrates PNP4Nagios integrated with Icinga and Icinga-Web.


            Most of this information comes from the Icinga Wiki entry for PNP4Nagios on Icinga.

            Wednesday, April 9, 2014

            Nagios / Icinga Logic, Alerts and Notifications

            Nagios / Icinga provide a variety of notification types and correspondingly different media over which they are transmitted.  Thus, the notification system is robust because it uses IP, POTS and other defined media for transmission.  The system is also intelligent because the built-in service check and state processing logic can differentiate not only failed vs. degraded states, but also states that are unreachable and whose status can not be reliably determined.


            Consider this example.  A switch to which 48 hosts are connected fails.  What is the status of the hosts connected to the switch?  Are they also failed or simply unreachable?  From a troubleshooting standpoint, the problem is the switch.  A notification system that floods 49 (or more) error notifications when a switch fails is only flooding the support staff with misleading information from which identifying the real cause of the problem -- a failed switch -- is hidden in a large number of relevant, but misleading, notifications.

            Host and Service Check Logic

            Notifications are very important.  However, as described above, accurate notifications upon which fast and informed corrective actions may be implemented are vital.  Nagios' / Icinga's notification accuracy begins with the host and service check logic.

            Parent - Child Relationships

            Parent - child relationships are specified in host definitions.  They are derived from the physical relationship between monitored nodes.  In the demonstration network, a monitoring server in Pittsburgh checks a host in Harrisburg; there are two monitored routers between them.  Thus, we can define a top-level parent -- the Pittsburgh Monitoring Server -- and a series of child hosts between, from the Pittsburgh Router to the Harrisburg Router to the Harrisburg Backup Server.  The parent definitions are:


            define host{
             host_name  pit-monitor.pittsburg.mydomain.com   ; <-- The monitoring host
             }
            
            define host{
             host_name  pit-router.pittsburg.mydomain.com ;<-- The Pittsburgh gateway router 
             parents          pit-monitor.pittsburg.mydomain.com
             }
            

            define host{
             host_name  hbg-router.harrisburg.mydomain.com ;<-- The Harrisburg router 
             parents          pit-router.pittsburg.mydomain.com
             }
            

            define host{
             host_name  hbg-backup.harrisburg.mydomain.com ;<-- A Harrisburg host
             parents          hbg-router.harrisburg.mydomain.com
             }
            

            Host Up - Down - Unreachable Status

            A host that responds to a monitoring server check is considered in an UP state.  Without using host check parent - child logic, any host that does not respond would be considered in a DOWN state.  Nagios / Icinga have a more sophisticated view of the network.  If a host is DOWN, it's child hosts (and their children) will initially report DOWN, but the check logic determines that the child hosts are UNREACHABLE.  For instance, if 48 hosts are connected to a switch, the 48 hosts have a parent definition for the switch.  If the switch fails, it reports DOWN and the 48 connected hosts report UNREACHABLE.

            Host and Service Error States

            The parameter max_check_attempts is defined for each host and service (often in templates).  This parameter defines the difference between Hard and Soft host and service states.  When a host or service check results in a non-UP or non-OK result, it is initially considered in a Soft state.  Once the number of non-UP or non-OK check results equals the value of max_check_attempts, it is then considered in a Hard state.  Hard error states are also applied to transitions from any hard error state to another.

            The distinction between Soft and Hard states is important for Nagios / Icinga logic.  Event Handlers -- actions that attempt to, for instance, correct an error -- execute when ahost or service is in a Soft state.  Notifications do not occur until hosts and services enter a Hard state.

            Delaying the notifications until Hard states occur is also important because it allows Nagios / Icinga time to determin if monitored hosts and, thus, their services are DOWN or UNREACHABLE.

            Defining Notifications

            Notifications occur when hosts and services enter a Hard state.  Additionally, if a host is in a DOWN or UNREACHABLE state, there are no notifications for its services.  That is, if the host is DOWN, the failure of its services are implied and no notifications are necessary.

            Who is notified

            Notification destinations are defined as contact and Contact and Contact Group definitions.  Each contact includes a contact name and alias, definitions of the commands by which notifications are sent (e.g. e-mail and pager) and the addresses to which the notifications are sent.  Contact Groups simply define multiple logically-grouped Contacts.   Thus, you may define a group of server administrators who are notified when servers fail and infrastructure administrator who are notified when switches and routers fail.

            You may also define timeperiods for which notifications are sent.  Thus, notifications for critical equipment may sent 24 x 7 x 365, while notifications for development servers are only sent 9-5 Monday through Friday.

            Notification Methods

            Nagios / Icinga are capable sending notifications over multiple media types.  If one media type is not available (e.g. IP for e-mail notifications), redundant media (such as POTS) are available.  The media include:
            • Email
            • Pager
            • Phone (SMS)
            • WinPopup message
            • Yahoo, ICQ, or MSN instant message
            • Audio alerts
            The multiple media provide additional robustness for delivering notifications during service outages.

            Nagios / Icinga Notification Demonstration

            The video below demonstrates two cases:

            1. A service failure on a single host at the end of a parent-child chain, and
            2. The failure of all WAN links on a router that isolates hosts in a data center from the monitoring server.
            The monitoring server in is Pittsburgh, at the lower right of the map.  The service failure (1) occurs in Philadelphia and a single notification each for its failure and recovery is dispatched by e-mail.  The router WAN link failure (2) occurs on the Harrisburg router in the bottom center.  That failure isolates the backup server in the Harrisburg data center from the Pittsburgh monitoring server.  However, the host and service check logic isolates the failure as a Host DOWN state for the router and Host UNAVAILABLE state for the data center.  A single notification -- Harrisburg Router DOWN -- is dispatched by Nagios / Icinga because the notifications are configured to ignore UNAVAILABLE states.  Thus, a single root-cause notification is sent to the proper administrator instead of dozens of notifications for host and services in the data center.


            Tuesday, April 1, 2014

            High Availability Zabbix and Zabbix Proxy Servers

            <data:blog.title/> <data:blog.pageName/>

            Introduction

            This article explains how to install high availability (fail over) Zabbix and Zabbix Proxy servers.

            High-availability clustering is designed to increase systems availability.  For this article, we will be using:
            • Distributed Replicated Block Device (DRBD)
            • Corosync - Pacemaker
            These technologies present two servers as one to the network; one server is active and the other is waiting to take over if the first fails or is taken off line.

            The cluster is composed of elements that differ from a single-server deployment.  
            • Resources unique to each node
            • Data shared between nodes on the cluster
            • Services shared between the nodes on the cluster

            Resources Unique to Each Node

            Each node has is a server with its own operating system and hardware.  The processor, memory, disk and IO subsystems (including network interfaces) are controlled by the operating system installed on the boot partition.

            Data Shared Between Nodes on the Cluster

            For a MySQL cluster, there are two types of shared data:  configuration files and databases.  The configuration files are those located in the /etc/mysql/ directory.  When shared between the two nodes, the MySQL server will have an identical configuration regardless of the node that is active.  However, there are circumstances in which the MySQL configuration files may be unique to each server.  The databases are kept in the /var/lib/mysql/ directory and include the log files.

            MySQL Clustering Caveats

            Although the two nodes share the same MySQL databases, UNDER NO CIRCUMSTANCES SHALL THE TWO NODES SIMULTANEOUSLY ACCESS THE DATABASES.  That is, only one node may run the mysqld daemon at any given time.  If two MySQL daemons access the same database, there will eventually be corruption.  The clustering software controls which node accesses the data.


            DRBD - Corosync - Pacemaker Overview

            The illustration below depicts a high-availability cluster design.  Each server has four network interfaces:

            • eth0 -- the publicly addressable interfaces
            • eth1 -- the DRBD data replication and control interfaces
            • eth2 and eth3 -- the Corosync - Pacemaker control interfaces

            The first interface -- eth0 -- is the publicly addressable interface that provides MySQL database and Apache web server (for PHPMyAdmin) access.  Two IP addresses (unique to server) are assigned at boot time and a third is assigned by the Corosync - Pacemaker portion of the clustering software.

            The second interface -- eth1 -- is controlled by the DRBD daemon.  This daemon is configured with two or more files: /etc/drbd.d/global_common.conf and /etc/drbd.d/ro.res, r1.res, r2.res... assigned for each shared block device.  For this example, only r0.res is installed.  System-wide settings are defined in the global_common.conf file.  Settings specific to each pair of shared block devices are defined in the r0.res (and other) resource files.  DRBD defines an entire block device (or hard drive) as shared and replicated between two nodes.  In this example, block device /dev/sdb (a SCSI drive in each server) is shared between the two nodes as /dev/drbd0.  Once configured, both servers see /dev/sdb as a new block device /dev/drbd0 and only ONE may mount it at any given time.  The server with the mounted partition replicates any changes to the failover node.  If the first server fails or is taken off line, the other server immediately mounts its /dev/drbd0 block device and assumes control of replication.

            The third and fourth interfaces -- eth2 and eth3 -- are controlled by the Corosync - Pacemaker software.  These interfaces provide communication links defining the status of each defined resource and control how and where shared services (such as shared DRBD block devices, IP addresses, and the MySQL / Apache2 daemons) run.  In failover clustering, only one node may actively be in control at any time.


            Installing and Configuring the Zabbix - MYSQL - Apache - Postfix Failover Cluster

            Begin by installing and MySQL, Apache and Postfix.  Leave MySQL listening on the default loopback interface 127.0.0.1.  Then, start the Linux Cluster Management Console (LCMC) -- a Java application that will install and configure everything required for clustering.  Select the two nodes by name or IP address, install Pacemaker (NOT Heartbeat) and DRBD.

            Once both nodes have the required software, configure the cluster.  LCMC will prompt you for two interfaces to use in the cluster (select eth2 and eth3) and the two-node system will be recognized as a Cluster.  Configure global options and then select device /dev/sdb on one node and mirror it to /dev/sdb on the other to configure DRBD device /dev/drbd0.  Format it with an ext4 file system and make sure to perform an initial full synchronization.

            When the DRBD device finishes synchronization, create a shared mount point -- /mnt/sdb -- and IP address (10.195.0.100 shared between eth0 on the nodes).  The cluster will now recognize the DRBD device as a file system on the Active node.

            The shared data must then be moved to the DRBD device.  Stop MySQL on each node.  On the Active node, move the directories /etc/mysql, /var/lib/mysql and /etc/zabbix/ to /mnt/sdb/etc/mysql, /mnt/sdb/var/lib/mysql and /mnt/sdb/etc/zabbix, respectively, and create symlinks back to their original locations.  On the Inactive node, delete the mysql and zabbix directories and replace them with symlinks to the same locations -- even though those locations are not yet visible.

            The LCMC console is then used to finalize the shared services.  Add Primitive LSB Init Script resources (that is, only running on one server at a time) for MySQL, Apache2, Postfix, Zabbix Server and Zabbix-Agent.

            Fail the servers back and forth several times to check that the system performs as expected.  Finally, install a database.  For this article, I install the Zabbix Monitoring database.

            The video below illustrates the entire installation and configuration process.


            Installing the Zabbix Proxy - MySQL Failover Cluster

            Zabbix Proxy only requires the zabbix-agent and zabbix-proxy-mysql packages.  The proxy is linked to the server by configuration file settings.  It is then configured and controlled through the server console.

            The cluster configuration -- unlike the system set up -- is very much like configuring Zabbix Server failover clustering.  Similar hardware and identical clustering software and symlinked shared directories are used.

            The video below demonstrates the Zabbix Proxy failover cluster installation.


            Zabbix Proxy Performance

            Zabbix Proxy is not designed to distribute load.  While it has its own database, is configured from and subordinate to a Zabbix server, all the results are still processed by the Zabbix server.  There is a small performace improvement at the server, but not much.

            Zabbix Proxy is intended to provide fault-tolerance, particularly across unreliable links.  The brief video below demonstrates the process loads on an active Zabbix Server and Proxy.


            SAN-Backed High Availability MySQL Servers

            High-Availability Clustering Technologies

            High-availability clustering is designed to increase systems availability.  In a previous article, we looked at DRBD-based file storage -- analogous to network disk mirroring.  For this article, we will be using:
            • SAN-Backed Storage
            • Corosync - Pacemaker
            DRBD is useful in situations that lack a SAN.  However a good storage network design is preferable for reliability and performance.  DRBD runs as a daemon on each node, replicating block devices.  There is increased overhead, not only for disk IO, but also for processor iowait states and memory usage.  This overhead is relieved by a SAN, particularly valuable when deploying resource-intensive database servers.

            The cluster is composed of elements that differ from a single-server deployment.  
            • Resources unique to each node
            • Data shared between nodes on the cluster
            • Services shared between the nodes on the cluster

            Resources Unique to Each Node

            Each node has is a server with its own operating system and hardware.  The processor, memory, disk and IO subsystems (including network interfaces) are controlled by the operating system installed on the boot partition.

            Data Shared Between Nodes on the Cluster

            For a MySQL cluster, there are two types of shared data:  configuration files and databases.  The configuration files are those located in the /etc/mysql/ directory.  When shared between the two nodes, the MySQL server will have an identical configuration regardless of the node that is active.  However, there are circumstances in which the MySQL configuration files may be unique to each server.  The databases are kept in the /var/lib/mysql/ directory and include the log files.  These will be copied to a shared ext4 partition.

            MySQL Clustering Caveats

            Although the two nodes share the same MySQL databases, UNDER NO CIRCUMSTANCES SHALL THE TWO NODES SIMULTANEOUSLY ACCESS THE DATABASES.  That is, only one node may run the mysqld daemon at any given time.  If two MySQL daemons access the same database, there will eventually be corruption.  The clustering software controls which node accesses the data.

            Corosync - Pacemaker Overview

            The illustration below depicts a high-availability cluster design.  Each server has four network interfaces:
            • eth0 -- the publicly addressable interfaces
            • eth1 -- the iSCSI interfaces
            • eth2 and eth3 -- the Corosync - Pacemaker control interfaces
            The first interface -- eth0 -- is the publicly addressable interface that provides MySQL database and Apache web server (for PHPMyAdmin) access.  Two IP addresses (unique to server) are assigned at boot time and a third is assigned by the Corosync - Pacemaker portion of the clustering software.

            The second interface -- eth1 -- is controlled by the open-iscsi daemon that connects to iSCSI SAN storage.

            The third and fourth interfaces -- eth2 and eth3 -- are controlled by the Corosync - Pacemaker software.  These interfaces provide communication links defining the status of each defined resource and control how and where shared services (such as shared DRBD block devices, IP addresses, and the MySQL / Apache2 daemons) run.  In failover clustering, only one node may actively be in control at any time.


            Installing and Configuring the MYSQL - Apache Failover Cluster

            Begin by installing and MySQL and Apache.  Leave MySQL listening on the default loopback interface 127.0.0.1.  Then, start the Linux Cluster Management Console (LCMC) -- a Java application that will install and configure everything required for clustering.  Select the two nodes by name or IP address, install Pacemaker (NOT Heartbeat).

            Once both nodes have the required software, configure the cluster.  LCMC will prompt you for two interfaces to use in the cluster (select eth2 and eth3) and the two-node system will be recognized as a Cluster.  Configure global options for the cluster and begin by adding a the shared storage device.  In this case, the SAN partition is formatted with ext4 and recognized as device /dev/sdc1 on each node.  Mount it at /mnt/dev/sdc using the LCMC Filesystem resource.

            The shared data must then be moved to the DRBD device.  Stop MySQL on each node.  On the Active node, move the directories /etc/mysql and /var/lib/mysql to /mnt/sdc/etc/mysql and /mnt/sdc/var/lib/mysql, respectively, and create symlinks back to their original locations.  On the Inactive node, delete the mysql directories and replace them with symlinks to the same locations -- even though those locations are not yet visible.

            The LCMC console is then used to finalize the shared services.  Add a shared IP Address 10.195.0.110/32 and Primitive LSB Init Script resources (that is, only running on one server at a time) for MySQL and Apache2.

            Fail the servers back and forth several times to check that the system performs as expected.  Finally, install a database and modify the /etc/mysql/my.cnf configuration file, removing the loopback 127.0.0.1 address and subtituting the shared 10.195.0.110 address.  For this article, I install two Zabbix Monitoring databases (zabbix_01 and zabbix_02) for use in distributed monitoring.

            The video below illustrates the entire installation and configuration process.


            Scaling High Performance and Availability Zabbix Systems Monitoring

            <data:blog.title/> <data:blog.pageName/>

            Background


            Systems Engineers frequently comment about heavy loads, performance and scalability problems with Zabbix installations.  Indeed, Zabbix places a heavy load on resources; processes service check information, writes to a database, uses a PHP web application to present data and caches history information.  The database alone can be a heavy processor - memory and disk IO load.  Adding the other processor and memory intensive processes simply adds to the system load.

            However, Zabbix was designed to scale up to very large demands.  Those only familiar with the default all-in-one web-application-database installation may consider implementing the available modular architecture to distribute loads.

            Scalable Zabbix Architecture

            A Scalable Zabbix implementation distributes loads among three classes of servers:
            1. Database Back End Servers
            2. Zabbix Application Servers
            3. Zabbix GUI Web Front End Servers
            This article will explain how to implement these classes of servers in a highly scalable deployment.  A High-Availability SAN-Backed MySQL-PHPMyAdmin server will provide two databases, zabbix_01 and zabbix_02.  The child node database will send information to the Master Node, from which data and configurations for all child servers are available.  There are two Zabbix Application Servers dedicated to processing host checks.  There is one GUI Web Front End server dedicated to processing and presenting information (graphs, etc.).


            This is a relatively simple implementation of a Scalable Zabbix architecture.  Additional descriptions of High-Availability systems are recommended reading:
            The two Zabbix Application and one Zabbix GUI Front End servers may all be deployed as high availability clusters.

            Deploying Scalable Zabbix Servers

            Create and Populate the Databases

            The first task is deploying the two required databases -- zabbix_01 and zabbix_02 -- on the database server.  This is depicted at the end of the video in SAN-Backed High Availability MySQL Servers.

            Deploy the Zabbix Application Servers

            The two Zabbix Application servers may then be deployed.  Although they only require the zabbix-server-mysql package, you may wish to deploy the zabbix-frontend-php package for initial configuration.  The Apache and MySQL servers installed may be disabled or removed once they are defined and Master and Child servers.  I typically configure the servers entirely from the /etc/zabbix/zabbix_server.conf file, specifying the desired database server (in this case hbg-db.harrisburg.mydomain.com) and database credentials.  It is necessary to also specify a unique NodeID for each server, ranging up to 999.

            Once the server is installed, configured and connected to its own database, you must then upgrade the databases from each server for distributed monitoring.  ONLY UPGRADE THE DATABASE ONCE.  Running the upgrade more than once will result in database corruption. To perform the upgrade:

            • Stop the Zabbix and Apache services
            • Issue the command: zabbix_server -n <NodeID> -c /etc/zabbix/zabbix_server.conf

            Deploy the GUI Web Front End Server

            The front end only requires the zabbix-frontend-php package.  Once installed, browse to the /zabbix directory and perform the web-based installation.  This server must connect to the backend database cluster (hbg-db.harrisburg.mydomain.com) and the Master Zabbix server (monitor01.harrisburg.mydomain.com).

            Once installed, update the default Zabbix Server information to reflect the local nomenclature.  Then, set it as a Local Node, ID 1 and add the child Zabbix Server as Node 2.  Once completed, move to the graphical front-end on the child node (this is the only time it will be needed).  Update its default information and then specify it as a local Node ID 2 and add the Master server Node ID 1.  Then move back to the Master Server GUI and check that the architecture is updated (i.e. the child database is feeding information to the master).

            From this point on, other than selecting the desired node, all configuration procedures are like a stand alone Zabbix installation.  The process is illustrated in the video below.