
Introduction
Nagios -- and its fork Icinga -- is one of the most common systems monitoring tools available. Among its strengths are notifications and topological relationships. Properly configured, it does not send out large numbers of (meaningless) notifications for an entire subnetwork because the router/switch between it and the monitoring host fails.There is a great deal to learn about Nagios Core (that ships with many Linux distributions. A few of the author's own articles provide additional details on how to configure it.
Nagios Basics for Infrastructure
The single most important concept to understand for monitoring switches and routers with Nagios is the Parent relationship. Nagios provides a field in the host definition that specifies a host between the monitoring server and host. In the image above, the Monitoring Server is a parent to the COU_Switch. The COU_Switch -- in turn -- is a parent to both the COU_7206 and COU_3745 Routers. This is a simple topology and redundant links are a more complicated issue beyond the scope of this article. Properly defined, when a parent host fails, the child hosts register as Unreachable rather than Down. When registered as Unreachable, Nagios does not send out alerts. Thus, if a router fails, it registers as Down and an alert is sent; the child hosts register as Unreachable and no notifications are sent. This provides a mch simplified set of data to determine the root causes of problems.The second important concept to understand about Nagios for monitoring switches and routers is the Simple Network Management Protocol (SNMP). SNMP is an IETF standard for collecting and reporting host information. Networking equipment generally supports SNMP Version 2c or higher. In its simplest configuration, SNMP is configured to listen on one or more interfaces and requires a community string (the general default is "public") and will report information to a monitoring host. See the link at the beginning of this paragraph for more information.
Nagios with Check-MK
Check-MK is an addition to Nagios Core. Perhaps that is an understatement. Check-MK provides host agents that automatically poll and return information to the monitoring server. Livestatus is a broker module that interprets returned host agent data and translates it into Nagios for processing. Multisite and WATO are web-based configuration and reporting tools.In short, Check-MK is a tool that greatly simplifies host check configurations.
Installing Nagios with Check-MK on Debian
You may install Check-MK from Debian repository packages. However, a much simpler method is to download the Open Monitoring Distribution (OMD). This is a package built for a variety of major distributions. The following steps are for Debian Wheezy using the current package at the time of writing:- Download the 102 Megabyte OMD package: wget http://files.omdistro.org/releases/debian_ubuntu/omd-1.20.wheezy.amd64.deb
- Run the command dpkg -i omd* -- this will fail because dependencies are not met but Debian will correct that issue.
- Run the command: apt-get -f install to add the missing dependencies; you will need to configure MySQL with a root user password.
- Run the command dpkg -i omd*
The agent package is also available and this may be installed from the Debian repositories using apt. The agent runs under xinetd, and the configuration file is /etc/xinetd/check_mk. The last line must be changed from "disable = yes" to "disable = no" at a minimum. You may also restrict access to specified IP addresses. Once changed, simply restart xinetd.
Creating a monitoring site is easy. Issue the command "omd create <site_name>." For this article, we shall use the site name COU. This command:
- creates a directory structure /opt/omd/COU under which configuration files are maintained.
- a new user and group COU; the user is also a member of the group omd.
You may modify configuration files (e.g. /etc/apache/*, /etc/nagios/*) as necessary, but the distribution is ready to run and configure from the web interface. Start the site with the command "omd start <site_name>."
Configuring OMD using the Check-MK Web Administration Tool (WATO)
The new site is available under the web server's /COU directory. The default logon is user name "omdadmin" and password "omd."
The initial page is an overview of different web-based tools such as Nagios, Icinga, Thruk and NagVis.

Check-MK is another web interface that may be used with Nagios, but in this case it is also integrated with the Check-MK suite and includes tools such as WATO for configuration, the Livestatus Nagios event broker and a very efficient Check Engine that submits results to Nagios as passive checks, saving a great deal of processing -- an effective alternative to NSCA.


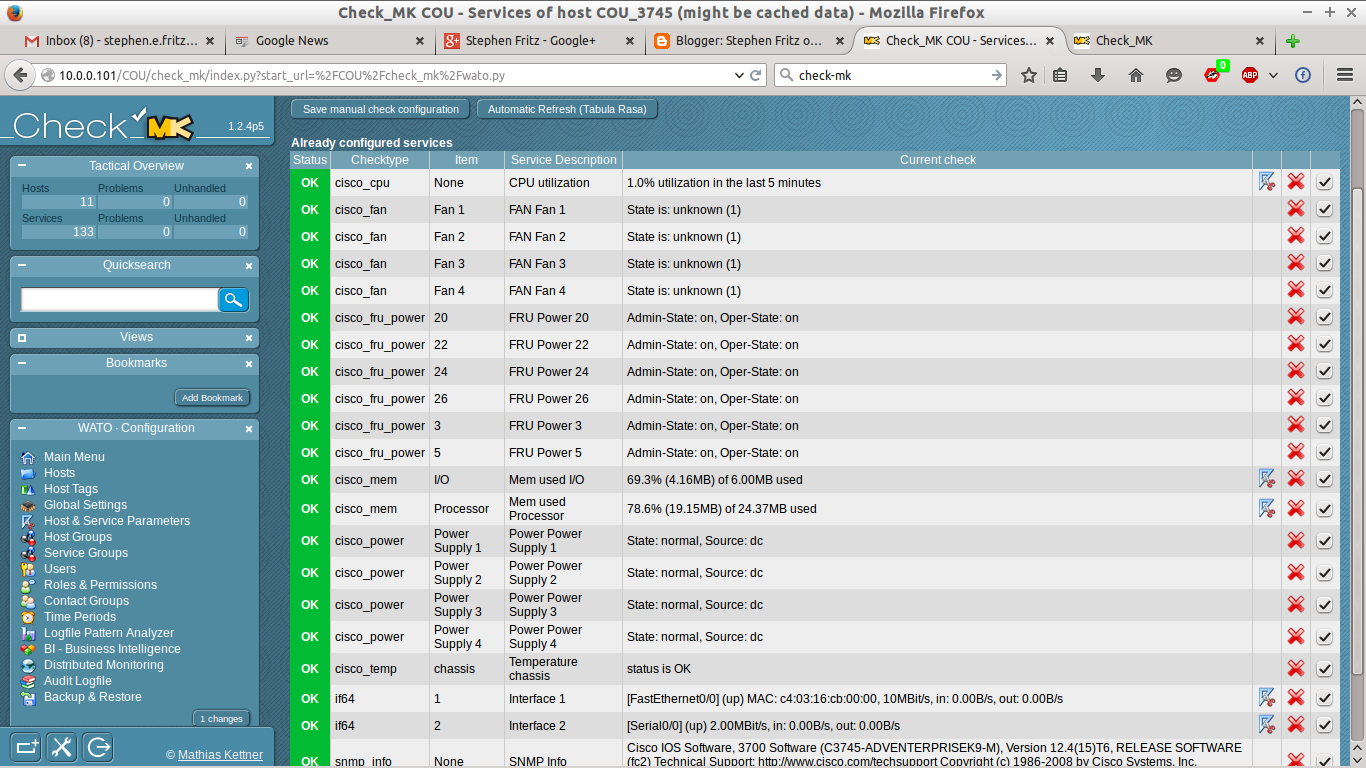
By default, the SNMP Discovery process only searches for Ethernet and Frame Relay devices on all hosts. If you have SONET or other interfaces, you must activate them from the Global Configuration screen. That process is depicted in the video at the bottom of this article.


The video below depicts OMD installation on Debian Wheezy, a rather simple process described above.
The video below depicts configuring OMD for monitoring eight Cisco routers and two Linux Layer 2 Switches using the Check-MK interface.
No comments :
Post a Comment