Systems Engineering with a focus on Linux/Microsoft Monitoring, Trend Analysis, Performance Optimization, Scalability and Security.
Integrating Linux Appliance Servers into Microsoft Windows Server infrastructure.
NConf is a web-based graphical configuration tool for Nagios/Icinga objects. It uses a small MySQL database to store configurations information and provides scripted configuration files installation.
NConf installation is straightforward.
Copy and extract the NConf tarball to the web root directory and change the ownership of the directory and its contents to the web server user (www-data).
Browse to NConf at http://<servername>/nconf, where you will be prompted to initiate the installation. The install first checks the installed packages and then prompts for the database configuration. Since the database does not yet exist, create and populate it with PHPMyAdmin. In this demonstration, I use the MySQL root user, but a live deployment should use a new user with limited privileges.
Configure the base path and -- very importantly -- specify the location of the Nagios / Icinga executable binary. NConf uses this to check its configurations.
Configure application authorization.
Delete the INSTALL and UPDATE directories and INSTALL.php and UPDATE.php files. NConf is now ready to use.
Migrating Existing Nagios /Icinga Configurations
NConf provides a script to migrate existing Nagios / Icinga definitions into its database, saving the administrator the task of manually recreating live configurations. NConf can only import one type of object at a time, so all object configuration definitions must be placed in separate files. This is not a difficult task using a text editor. Once the configuration files are properly written for NConf, use the import utility as described below.
Remove all Nagios / Icinga configuration files
Use the "/bin/add_hosts_from_nagios.pl" script to import objects as described in the Nagios Import Documentation.
Correct any import errors. Expected and common errors are listed in the documentation.
Deploy the configuration locally using the "/ADD-ONS/deploy_local.sh" script.
Adding a New Service Group with Five Services
Adding objects using the graphical interface is straightforward if you understand the structure of Nagios / Icinga configuration files. Adding five Advanced Services (to check monitoring agents using tcp_checks) and assigning them to existing Host Groups and a new Service Group is demonstrated below. 44 new objects on 11 hosts result from the update.
Adding a New Service Group with Five Services Using Scripts
The NConf documentation states that the "/bin/add_hosts_from_nagios.pl" script is intended for one-time use. This overlooks the usefulness of the script for quickly creating new objects. The experienced Nagios / Icinga administrator writes object configurations quickly and importing them from .cfg files can be faster than configuring them from the graphical interface. It also allows as administrator to maintain preconfigured object definition files for large deployments. For instance, if an enterprise upgrades its entire switch / router infrastructure, the administrator may configure object files in advance and deploy them as the equipment is installed.
The video below demonstrates creating the same Advanced Services and Service Group objects as performed above using scripts.
NConf is a useful tool for maintaining and deploying configurations. It is not a substitute for understanding the structure and optimization of object configuration files; it is complementary to that knowledge and experience. In practice, graphical configuration with NConf and editing configuration files are is iterative and complementary. NConf is particularly useful for renaming objects because any changes are updated globally throughout all configuration objects. But the administrator must also be able to understand the file structure to optimize definitions.
<data:blog.title/><data:blog.pageName/> Nagios/Icinga load their configurations from a series of .cfg files. This article describes (and provides basic examples of) the different files that control the Nagios/Icinga daemon and the objects it checks.
Main Configuration File
The Main Configuration File (/etc/nagios3/nagios.cfg or /etc/icinga/icinga.cfg) defines global environment settings for the Nagios / Icinga Service. There are only a few items a beginning Nagios / Icinga administrator needs to alter in this file:
Configuration file location paths
Enabling External Commands
Enabling NDOUtils / IDOUtils Database Integration
Advanced administrators may choose to set a wide array of performance and environment variables, but that is beyond the scope of this article.
Object Configuration Files
Object Configuration Files define all of the objects, services, events and actions Nagios / Icinga uses to monitor a network. There are 19 commonly-used definitions within the configuration files:
Services and Service Groups
Hosts and Host Groups
Host and Service Templates
Notification Escalations
Host and Service Notification Escalations
Extended Host and Service Information
Contacts and Contact Groups
Commands
Time Periods
Host, Service, Notification and Execution Dependencies
These 19 commonly-used definitions are explained in the Nagios Documentation, available as a downloadable .pdf file. Icinga Documentation is available online or as downloads.
Debian Wheezy Default Installation Files
At installation, Debian Wheezy provides the following Nagios configuration files and definition statements:
1) contacts_nagios2.cfg (Contacts and Contact Groups)
Notice how the above files organize commands. For the most part, each type of definition has its own file. However, there are related definitions placed together, and some of the services are split between files.
all Contact and Contact Group information are placed in the contacts_nagios2.cfg file,
all Host and host-specific Services information are placed in<hostname>_nagios2.cfg file and
all services assigned to multiple hosts in the services_nagios2.cfg file.
Thus, the installed object definition files specify 9 of the 19 commonly-used configurations in 8 files. The contacts_nagios2.cfg file specifies Contacts and Contact Groups. Services are defined in two files: localhost_nagios2.cfg and services_nagios2.cfg. There is a subtle, but important, distinction. Those defined in the localhost file are specific to that host; those specified in the services file may be applied to multiple hosts using Host Groups and Service Groups.
Following the example above, one would continue defining
all Contact and Contact Group information in a single file (e.g. contacts.cfg)
all Services used by multiple hosts in a single file (e.g. services.cfg) and
hosts and host-specific services in separate files for each host (e.g. <hostname>.cfg)
This is a logical solution and easy to troubleshoot. However,it is not necessarily the most efficient way to describe a network. With experience, it becomes more manageable to use 19 different files, each with its own specific definitions corresponding to the first bullet list in this section. More on the in Advanced Configuration. Nagios / Icinga are designed for flexible configuration. At service start up, they read all files with a .cfg extension – regardless of name – within the specified paths and use all properly-formatted “define” commands. This allows the administrator to define any sets of definitions that sensibly define the network.
The video below demonstrates the flexibility and portability of Nagios / Icinga configuration files. A fully-configured Icinga server monitoring 11 hosts for 287 services uses 14 configuration files in two directories to define the network. These files are grouped by the type of defintions they contain (e.g. Hosts, Host Groups, etc.) A Nagios server's Main Configuration file is modified to only search the /etc/nagios3/conf.d directory for definition files. The Icinga files are all copied to the Nagios server, which is then restarted. After five minutes, the two servers return identical information about the network.
Manually-Written Configuration Files
Writing Nagios / Icinga configuration files requires trial and error experience. Learning how to correctly – and efficiently – define a network is best learned in a test environment. Hence these articles use virtual machines installed on a laptop for demonstration purposes.
Network definitions using the sets of logical definitions installed by default works well. For instance, each host on the network will have its name and host-specific services defined in a file, resulting in a<hostname>.cfg file for each node; Services and Service Groups may be defined in a single services.cfg file; Contacts and Contact Groups may be defined within a single contacts.cfg file, etc. The administrator must, however, adhere to a uniform and logically-understandable format or the configuration quickly becomes unmanageable. Below is a brief set of example commands using the configuration file format in which each type of definition is included in a separate file. These commands ARE NOT optimized, with some duplication of definitions between hosts/services and host templates/service templates. However, definition file optimizations are another topic. Services
define service {
service_description Hardware - CPU Processes - Total
members pit-monitor.pittsburgh.mydomain.com,pit-router.pittsburgh.mydomain.com,pit-san.pittsburgh.mydomain.com,hbg-router.harrisburg.mydomain.com,hbg-backup.harrisburg.mydomain.com,phl-router.philadelphia.mydomain.com,phl-san.philadelphia.mydomain.com,phl-monitor.philadelphia.mydomain.com,laptop.coudersport.mydomain.com
}
define hostgroup {
hostgroup_name debian_servers
alias Debian Servers
members pit-monitor.pittsburgh.mydomain.com,pit-router.pittsburgh.mydomain.com,pit-san.pittsburgh.mydomain.com,hbg-router.harrisburg.mydomain.com,hbg-backup.harrisburg.mydomain.com,phl-router.philadelphia.mydomain.com,phl-san.philadelphia.mydomain.com,phl-monitor.philadelphia.mydomain.com
The base Nagios / Icinga installation uses files for all configuration and data storage. When the service starts, it reads the configuration from .cfg files listed in the Main Configuration File paths. Once the service has read and processed the configuration, it begins to collect and process data, with the results output to log files. Everything is file-based and the administrator may read the log files with a text editor or process them using log file analysis.
Nagios – Broker Module – Database Integration
Log files work well for small installations. However, they are too slow for large installations; they are not even used for more complex add-ons such as advanced web-based interfaces, visualizations and web-based graphical configuration tools. Scalable and utilitarian deployments require database integration.
Database integration is not limited to the Nagios / Icinga service. One example is the Icinga-Web advanced interface (as opposed to the Classic Icinga interface). Icinga-Web stores its configuration data in a database – named icinga_web on Debian Wheezy – and maintains data there. A second example is the NConf Nagios / Icinga configuration web-based configuration tool. NConf stores configuration information in its own database and outputs Nagios- / Icinga-compatible .cfg files that may be deployed to a server. These databases and tools may be deployed without integrating the Nagios / Icinga service with a database.
Database integration with the Nagios / Icinga process provides the previously stated scalability and utilitarian capabilities. The NagVis visualization package (to be discussed in another article) requires this integration. Thus, the administrator should enable it early in the installation and configuration process.
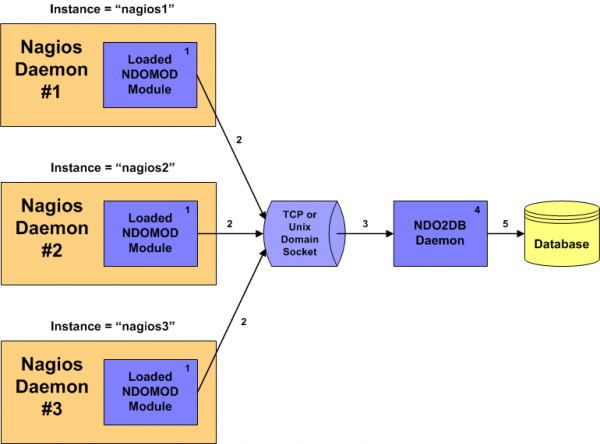
First, a simplified description of how these processes work is warranted. As previously described, the base Nagios / Icinga services read and write all configurations and output data to files. When integrated with a database, Nagios / Icinga still read the initial configuration information from .cfg files,just as before. However, output is no longer sent to files. The Main Configuration file specifies a broker module to output the data to the database. However, data is also protected from loss due database connection problems by first sending it to a temporary storage file. If the database is unavailable or a remote collector server can not reach the database server, the information is held locally until the connection is restored. The database contains all of the configuration information in tables and this is linked to output results tables. Keep in mind Nagios and Icinga do not use the database for startup configurations – this is still maintained in .cfg files – but that information is stored in the database to provide relations to the results.
Integrating with a database requires installing packages – ndoutils for Nagios and idoutils for Icinga. At installation, these packages create the requisite databases (ndoutils for Nagios and Icinga for Icinga) and provide the necessary modules. However, they are not enabled. The administrator must edit the Main Configuration file to enable database services. Once restarted, the broker module sends the configuration and output results information to the database.
The video below demonstrates and illustrates the process. In it:
Commence with a base Icinga installation
Illustrate the default MySQL Databases
Install the Icinga idoutils and Icinga-Web advanced web interface packages
Illustrate the MySQL database additions.
Modify the /etc/default/icinga configuration file and copy the broker module from /usr/share/doc/icinga-idoutils/examples/idoutils.cfg-sample to /etc/icinga/modules/idoutils.cfg to enable the database broker module
Restart Icinga
Illustrate the host table database changes upon enabling idoutils
Install configuration files defining 11 hosts and 250+ services
Nagios / Icinga are the core packages of an entire platform. This installation will include add-on packages -- IDOUtils for MySQL database support and Nagvis for visualization -- but the article will focus primarily on installing Icinga.
Icinga has a default web-based interface that is very similar to Nagios. However, there are add-on packages -- icinga-web and icinga-cgi -- that require a database. The illustration below shows the installation command on Debian Wheezy. During the installation, a series of pop-up screens will provide configuration prompts. The first step is to install and configure the Postfix mail server and MySQL database server. After those are installed, add Icinga, Icinga-Web, Icinga-IDOUtils (for database support) and Nagios-NRPE / Nagios Service Check Acceptor for remote host checks. The video below illustrates a command-line installation.
The applications are now installed and operational -- accessible at http://<servername>/icinga. The default installation includes a basic configuration for "localhost" at the loopback address 127.0.0.1. However, there are several tasks to complete before the monitoring systems are functional.
1) Enable External Commands
sed -i -e 's/check_external_commands=0/check_external_commands=1/' /etc/icinga/icinga.cfg
2) Enable IDO2DB Database Functionality 3) Supply a working Nagios-NRPE configuration file 4) Modify the php.ini file's timezone settings for the Icinga-Web Instance Monitoring to work correctly Icinga's web interface to external commands will now work properly. Thus, a basic Icinga installation is now operational. The video below demonstrate's these steps and also includes an initialization of the system by restoring configuration files that describe the network.
Subsequent articles shall describe additional Nagios / Icinga features and their configuration.
Nagios/Icinga are enterprise class systems monitors that can track publicly-available services, agent-collected data and SNMP. Data is presented in web-based formats and --through additional packages -- graphs and user-configurable visualizations.
The Nagios project commenced in 1996 and was first publicly released -- as NetSaint -- in 1999. The project was renamed Nagios in 2002. By 2005, the project was receiving a great deal of attention from the Open Source Community and the developers formed Nagios LLC in 2007. By 2009, Nagios LLC began to release commercial products and provide support contracts.
Also in 2009, a group of developers forked the Nagios project to Icinga. The well-developed core project retains a great deal of compatibility with Nagios (particularly the configuration files), but offers independently-developed solutions and interfaces. Although the projects are forks, this article will discuss the two projects from a common perspective.
Monitored Systems
Publicly
Available Services
Publicly
available services are those shared to the network, such as HTTP,
SMTP, FTP etc. Essentially, these are the TCP and UDP services reported using the netstat command.
Host
Resources
Host resources are not shared across the network and include items such as hard drive / memory performance and utilization, processor utilization, network interface card statistics, etc. These performance parameters may not be directly accessed and rely on other methods -- including agents and SNMP -- to collect data.
Agents
Agents are application-specific software that run on the monitored host. In the Nagios and Icinga systems, the most common are:
Nagios Remote Plugin Executor (NRPE)
Nagios Service Check Acceptor (NSCA)
Agents are polled by the monitoring server and return data formatted for the Nagios application. NRPE, as the name implies, performs much of the data processing on the monitored host and returns results that are compatible with the application storage format; this architecture relieves the monitoring server of some of the processing load and distributes it among the monitored hosts.
Simple Network Monitoring Protocol (SNMP)
SNMP is defined by RFC's and provides a publicly-available standard for querying monitored hosts and returning standardized data.
Configuration
Files
Nagios and Icinga are configured with text files. There are a few differences between the main configuration file and several of the add-on files (e.g. database configuration), but the object configuration and command files are compatible.
Main
Configuration File
The /etc/nagios3/nagios.cfg and /etc/icinga/icinga.cfg files define environment, scheduling, logging and performance parameters for the monitoring daemons.
Object
Configuration Files
Objects are defined in a series of files in the /etc/nagios3/conf.d and /etc/icinga/objects directories. Objects may be divided into the following categories:
Services
Service Groups
Hosts
Host Groups
Contacts
Contact Groups
Commands
Time Periods
Notification Escalations
Notification and Execution Dependencies
Plugins
Nagios and Icinga do not maintain internal processes to perform service monitoring. Instead, these actions are performed by plugins, external executable files and scripts (perl, shell, etc.) that perform the host queries. Nagios and Icinga distributions typically ship with a set of plugins, but many more may be added from external sources, such as the Nagios Exchange.
Host
Checks
Host checks only determine if a host is available or not. The host definitions include parent/child definitions that define host dependencies and reachability logic. Host checks are performed:
At regular intervals in the host definition.
On-demand when a host's service state changes.
On-demand and controlled/triggered by host reachability logic.
On-demand and controlled/triggered by host dependency logic.
Hosts are reported as in an UP, DOWN or UNREACHABLE state. UP and DOWN are self-explanatory. UNREACHABLE is a state in which access to a host is no available because an intermediary host is DOWN. Thus, if a server is behind a router and the router is reported DOWN, the server will be reported as UNREACHABLE. Each state may be either HARD or SOFT. The SOFT state is reported at a host's first state change. It is then rechecked a specified number of times, after which it is the reported in a HARD state. These states are used to control things such as notification, reducing the number of false alarms from the system.
Service
Checks
Service checks poll the state of specific applications, hardware, software, etc. on individual hosts. The service definitions include parent/child definitions that define service dependencies and reachability logic. Service checks are performed:
At regular intervals, as defined by the service definition.
On-demand and controlled/triggered by predictive service dependency checks.
Services are reported as in an OK, WARNING, UNKNOWN or CRITICAL state. OK means the service has responded as expected. WARNING means the service has reported back to the polling server, but provided information that indicates it is outside defined optimal performance. CRITICAL means the service has failed to respond or has responded with information that indicates it is outside defined acceptable performance. UNKNOWN is a bit unclear; for instance an SNMP check that receives no response may report UNKNOWN rather than CRITICAL. Services, too, also report in HARD and SOFT states.
Active
Checks
Active checks are configured and controlled by the Nagios and Icinga applications.
Passive
Checks
Passive checks are performed on the hosts outside the Nagios and Icinga applications. The monitoring process accepts and interprets these service checks as they occur. They are typically asynchronous. Examples include SNMP Traps and Security Alerts.
State
Types
State types refers to the reliability that a given host/service state is accurate.
Soft -- the host has returned a changed service state, but it's reliability has not been verified by repeated rechecks.
Hard -- the host's state is considered reliable because it has been repeatedly checked.
Time
Periods and Notifications
Time periods define when:
Scheduled host and service checks are performed
Notifications are sent
Notification escalations may be used
Dependencies are valid
Notifications are messages sent via e-mail, pager, SMS, IM and other media in reponse to specific, defined events.
Event
Handlers
Event handlers are external scripts and actions that are triggered by Nagios and Icinga events.
Restarting a failed service
Entering a trouble ticket into a help desk system
Logging event information to a database
Power Cycling a host
Distributed,
Redundant and Fail Over Monitoring
Distributed, redundant and fail over networking are complex topics; Nagios and Icinga offer a great of software and implementations to achieve load distribution and redundancy.
DNX
Fusion
MNTOS
NDOutils, IDOutils
Gearman
Check_MK
The nature and implementations of these services are beyind the scope of this discussion and the reader is referred to project documentation for more detailed descriptions.
Predictive Monitoring
Predictive monitoring optimizes data collection using reachability logic, host and service dependencies. For instance, if a host is unreachable, there is no point expending resources monitoring its services. When the host is again reachable, obtaining updated information about its services is a priority. The following briefly illustrates and example.
In the first image, all hosts and services are available and monitored by a server in Pittsburgh, on the left of the image.
Operational Network -- Hosts and Services Available
A system failure -- the Harrisburg Router shuts down -- and predictive monitoring directives override default host and service checks. The image below depicts the Harrisburg Router as DOWN (red) and the Harrisburg Backup Server (connected to the WAN by through the router) as UNREACHABLE (purple).
A detailed status of the each office may then be reviewed. Note that the Harrisburg Router host is DOWN and its interfaces are CRITICAL (both red). The Harrisburg Backup host is unreachable (purple). However, the other services on these two hosts are a mix of CRITICAL (red) and OK (green). The monitoring server, upon determining that the router is DOWN ceases to check additional services. Those that report CRITICAL were polled before the router host was reported DOWN.
Harrisburg Data Center As Seen from Pittsburgh -- Router Down, Backup Unreachable, Several Services Down, Remaining Services not Polled
The Pittsburgh Data Center is local to the monitoring server and the Philadelphia Data Center is reachable through a redundant link. Those data centers report the far side of the Harrisburg WAN links are down.
Pittsburgh Data Center -- Harrisburg WAN Link Down
Performance
Tuning
Applications with the scope of Nagios and Icinga must, to be scalable, have performance tuning options. These generalizations briefly list what is available:
Service Check Latency Monitoring to quickly identify generally poor performance.
MRTG Performance Statistics to identify specific bottlenecks.
Process tuning through configuration file options.
Passive Checks that offload processing from the monitoring server to monitored hosts.
Embedded Perl Interpreter that offers better performance than an Operating System-installed Perl Interpreter.
Cached Logic and Host Checks that preclude unnecessary checks.